23

We created so many inefficient stored procedure in our application, we always postpone to make it more efficient until we have serious problem with database performance.

Now, I am thinking to fix it one by one order by most often executed stored procedure.

What is the best way to figure out which stored procedure is the most executed?

Is there a script that can show which stored procedure is the most executed?
Drew
  • 29,895
  • 7
  • 74
  • 104
Anwar Chandra
  • 8,538
  • 9
  • 45
  • 61

5 Answers5

26

Use:

SELECT TOP 10 
       qt.TEXT AS 'SP Name',
       SUBSTRING(qt.text, qs.statement_start_offset/2, CASE WHEN (qs.statement_end_offset = -1) THEN LEN(qt.text) ELSE (qs.statement_end_offset - qs.statement_start_offset)/2 END) AS actual_query,
       qs.execution_count AS 'Execution Count',
       qs.total_worker_time/qs.execution_count AS 'AvgWorkerTime',
       qs.total_worker_time AS 'TotalWorkerTime',
       qs.total_physical_reads AS 'PhysicalReads',
       qs.creation_time 'CreationTime',
       qs.execution_count/DATEDIFF(Second, qs.creation_time, GETDATE()) AS 'Calls/Second'
  FROM sys.dm_exec_query_stats AS qs
  CROSS APPLY sys.dm_exec_sql_text(qs.sql_handle) AS qt
 WHERE qt.dbid = (SELECT dbid
                    FROM sys.sysdatabases
                   WHERE name = '[your database name]')
ORDER BY qs.total_physical_reads DESC

Reference: SQL SERVER – 2005 – Find Highest / Most Used Stored Procedure

OMG Ponies
  • 325,700
  • 82
  • 523
  • 502
  • You can also extract the `SUBSTRING(Text, statement_start_offset/2, case when (statement_end_offset = -1) then len(Text) else (statement_end_offset-statement_start_offset)/2 end)` for the actual query inside the SP – Remus Rusanu Dec 21 '09 at 22:55
  • it should be SUBSTRING(qt.text, qs.statement_start_offset/2, CASE WHEN (qs.statement_end_offset = -1) THEN LEN(qt.text) ELSE (qs.statement_end_offset - qs.statement_start_offset)/2 END) AS actual_query, – Anwar Chandra Dec 22 '09 at 05:27
2

Another fantastic tool is Microsoft's Performance Dashboard.

https://learn.microsoft.com/en-us/sql/relational-databases/performance/performance-dashboard?view=sql-server-ver15

Chris Vesper
  • 646
  • 7
  • 18
n8wrl
  • 19,439
  • 4
  • 63
  • 103
1

A quick way to accomplish this is to run SQL Profiler, and then "group" your trace by TextData.

  • Go into your Trace Properties
  • Under the Events Selection tab, click on Organize Columns...
  • Click on TextData, and move it up to the "Groups" area.

You may also only want to watch specific events, like SQL Batch Completed. If I remember, that will give you durations and other handy stats to group/filter by.

GalacticJello
  • 11,235
  • 2
  • 25
  • 35
0

Typical situation..

Run the performance analyzer And then start your application set some filters to capture high number of reads/writes/scans etc..

TonyP
  • 5,655
  • 13
  • 60
  • 94
0

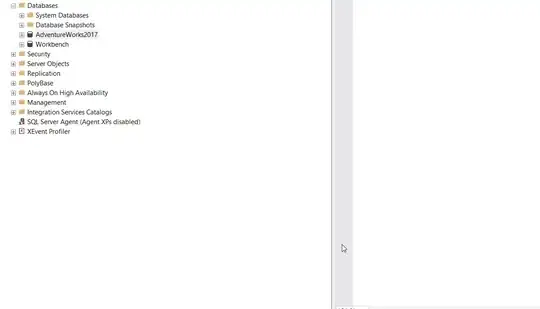
Most executed objects can be found by using SSMS. Right click DB Name > Reports > Standard reports > Object Execution Statistics. It is detailed in the below GIF imageenter image description here

Venkataraman R
  • 12,181
  • 2
  • 31
  • 58