I am trying to make an illustration that looks like this:

But instead I get this:
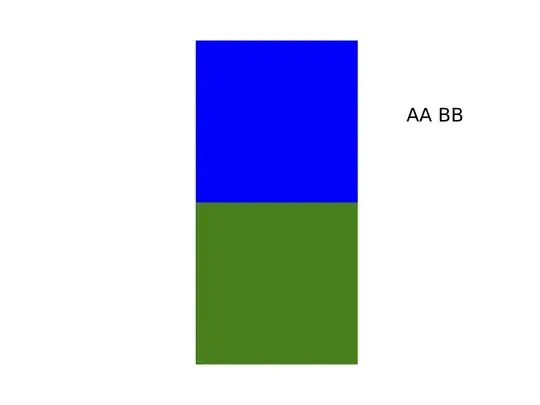
Here is my program:
from pylab import *
from matplotlib import colors
# A = [[1,2,3,4,5]]
A = [[0],[1]]
Amap = colors.ListedColormap(['blue','green'])

figure(1)
imshow(A, cmap=Amap, interpolation='nearest')
annotate('AA BB',xy=(0,0), xytext=(.8,0), fontsize=20)
axis('off')
savefig('graph-py.pdf')
show()
I've tried everything to get the arrow, but can't seem to make it happen. Any ideas?