##Example data to illustrate problem:
type=c("grp1","grp2","grp1","grp3","grp3","grp3","grp4")
num=c(1,1,2,4,3,5,1)
cols=c(rep("red",5),"green","red")
library(lattice)
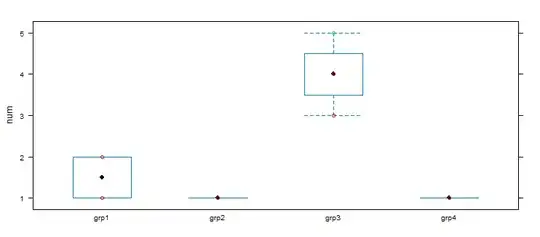
bwplot(num~type)
par(new=T)
stripplot(num~type,col=cols)
I like the additional information displayed by the box plot but I need the information conveyed by the coloured points in the strip chart. Obviously par(new=T) doesn't work, so how can I overlay the points onto the box plot?