3

I'm using SSRS for my reporting, my reporting solution is in Visual Studio 2008 Business Intelligence Development Studio.

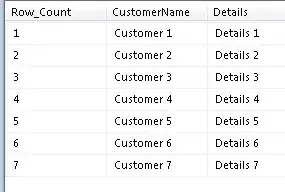
I have a report in which the data should be displayed in this format.

enter image description here

I have added a Column Group in my table which is having the values of Customer Name and details, the data is coming fine in the vertical format i.e column after column.

My Issue :

There should be only three columns in each row, after three records the next row should begin and again not more than three records should be displayed as shown in the image above.

My attempts : I tried to add a row group and in that gave the expression

= Ceiling(Fields!Row_Count.Value/3) here Row_Count is a field which is coming from my query which holds the serial number of the records.

My SQl Query

SELECT Row_Number() over(order by table_ID) AS Row_Count, Field_1,Field_2 from MyTable

In my Column group i have Customer Name and in my Row Group i have other details of the customer. The data is getting populated column wise but the issue is its not breaking the current row after three records. Below is my table of report.

enter image description here

Sam M
  • 1,077
  • 2
  • 20
  • 42

1 Answers1

2

You were on the right track. Say you have data like this:

enter image description here

I have created a tablix like this:

enter image description here

The Row Group expression is:

=Ceiling(Fields!Row_Count.Value / 3)

This works together with the Column Group expression to split over three columns:

=(Fields!Row_Count.Value - 1) Mod 3

The other thing to note compared to your tablix is that CustomerName is not in a table header row, but rather there are two row header rows, one for CustomerName and one for Details.

This is looking OK to me, obviously you can format to taste:

enter image description here

Ian Preston
  • 38,816
  • 8
  • 95
  • 92
  • I'm not sure what you mean; it looks like your Row Group expression is right, but you didn't mention your Column Group expression - I've added the one I used to get my report example working. Also, in your screenshot your **Customer Name** field is not in the row group but in the table header - you need to have two row group headers for the two Dataset fields. So these are the changes in the Report Designer you need to make? – Ian Preston Sep 28 '13 at 11:25
  • =Fields!First_Name.Value is what i have right now in my column group, do i need to add this Row_Count.Value - 1) Mod 3 instead of my earlier code? – Sam M Sep 28 '13 at 11:49
  • Yes, that's correct, in this scenario only the `Row_Count` value is used for both the row and column grouping; try changing the Column Group expression to `=(Fields!Row_Count.Value - 1) Mod 3` as above and see how this goes. – Ian Preston Sep 28 '13 at 11:52