I would like to draw a kind of PivotChart using Gnuplot. So I need to ignore some lines of data in my file. I tried the following:
unset key

set xtics font "Times-Roman, 5"
set ytics font "Times-Roman, 5"

set multiplot layout 4,3 #title "Multiplots\n"

plot [7:50][0:1] 'forStackoverGnuplot.txt' using 1:($2==0?($3==4?$4:NaN):NaN) with lines ti '4'
plot [7:50][0:1] 'forStackoverGnuplot.txt' using 1:($2==0?($3==4?$4:"fe"):"fe") with lines ti '4'
Datafile:
20  0   5   0.668593155
7   0   4   0.885223087
20  0   5   0.668593155
10  0   4   0.92239289
20  0   5   0.668593155
20  0   4   0.834947746
30  0   4   0.693726036
50  0   4   0.47169919
But I get:
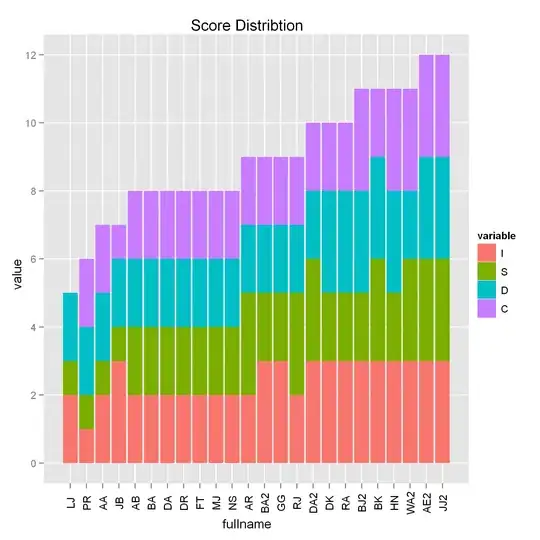
which is not the result I expected. What can I do? I want to let the data lines interlaced.