EDIT: The chart is fixed when I use a stacked chart instead of a stacked percentage chart, but this still doesn't tell me what is wrong with using the percentage chart.
I have a stacked percentage chart which is going from 0 to 10000% instead of 0 to 100%. It appears as if the values are formatted correctly (they add up to 1.01 due to rounding), and even dividing all the values by 100 in the query does not change it.
This is how the chart renders:
with the following Vertical Axis Properties:
I have a table below (with identical number formatting but with 2 percentage points), however that displays as expected:
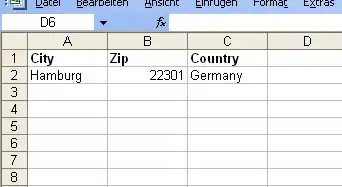
Finally, here is the raw data set with an additional sum column not reflected in SSRS:
Has anyone come across this issue before? If I manually set the range of the chart from 0-100% (0-1) I can only see that bottom blue series.