1

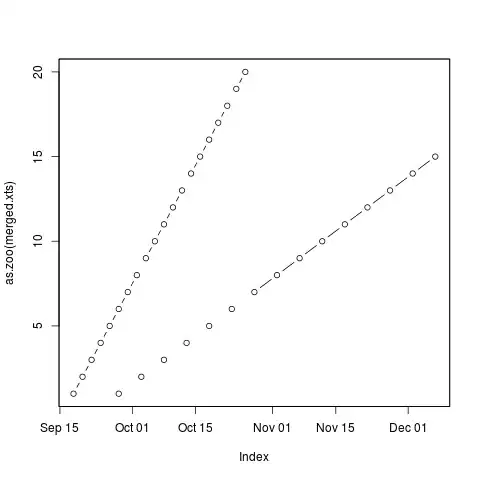
I have merged two xts objects and want to plot them in a single display. This works fine when I use points (type="p"). However, when I use lines (type="l") a problem occurs: the first series is shown only in the index region that is not covered by the second series. I would expect the lines to be as long as the "points". A reproducible example is posted below.

As this occurs with both the default and the ggplot plotting commands, I suspect that this relates to some property of time-series data.

What is the reason for this behaviour? Is there a proper way of plotting this kind of data?

## Minimal example for Reproduction
library(xts)
library(ggplot)
# create two artificial xts objects
xts1 <- xts(1:15,Sys.Date()+10+seq(from=1,by=5,length.out=15))
xts2 <- xts(1:20,Sys.Date()+seq(from=1,by=2,length.out=20))

# merge them
merged.xts <- merge.xts(xts1,xts2)

# Plot as zoo objects to allow for panels
# plotting with points shows both series
plot(as.zoo(merged.xts),type="p",plot.type="single")
Plotting with points

# plotting with lines
# The second series is "shortened"
plot(as.zoo(merged.xts),type="l",plot.type="single")

Plotting with lines

# Similar behaviour with ggplot2
autoplot(merged.xts)
Tungurahua
  • 489
  • 7
  • 21
  • What happens if you convert the `merged.xts` to plain vectors? – Carl Witthoft Sep 17 '13 at 19:57
  • Thanks for the quick reply! However, I don't really see how this is supposed to help. In my real dataset the timestamps are not spaced evenly, so I suppose that zoo or xts is what I need. But maybe I am missing something fundamental here? – Tungurahua Sep 17 '13 at 20:12

1 Answers1

3

Quite simply, type="l" looks the way it does because you can't plot a line on a single point. Set type="b" to see both lines and points.

points and lines and points and lines... it's like Morse Code!!!

Joshua Ulrich
  • 173,410
  • 32
  • 338
  • 418
  • Ah, I see. So it's the NAs that were introduced while merging. I would have thought that the lines would connect the existing points "skipping" the NA values. So it's possible to plot two series as lines only if they both have values at the index points. Thanks. – Tungurahua Sep 17 '13 at 21:09
  • @Tungurahua I understand how you could have thought that, but drawing lines _through_ missing values could also be thought of as misleading. If you want to fill in the `NA` for plotting purposes, you could use `na.locf`, `na.approx`, `na.spline`, etc. – Joshua Ulrich Sep 17 '13 at 21:16
  • @Tungurahua And thank goodness `R` treats NA the way it does. Excel's approach drove me mad for years. – Carl Witthoft Sep 17 '13 at 21:20
  • @CarlWitthoft Excel approach -- caught me there ;-) – Tungurahua Sep 17 '13 at 21:24