I'm not sure I understand WHY you are doing this, but, based on the comment which you posted above, it seems that you'd like to cluster 10 objects ('zero', 'one' 'nine') by comparing their values in your confusion matrix, generated by some other algorithm.
I would like the clusters to maximize the classification results: if
one class is mainly recognize as another one then both classes should
be fused.
... So, looking at your data, object 'eight' and object 'nine' might be in the same cluster because they have both have mostly low values and one relatively high value for the 'eight' column.
To do this, you can treat each of the 10 objects as having 10 arbitrary properties; then this is a standard setup. Perhaps Euclidean distance is appropriate to determine the distance between objects; you would know best.
It sounds like you'd like to do some hierarchical clustering, which you can do with scipy.cluster.hierarchy ; example below.
Example
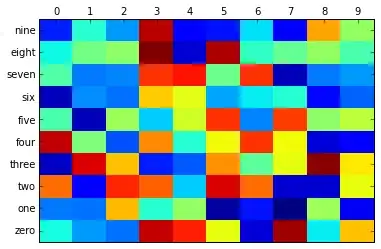
I didn't want to type up your data by hand, so I just randomly generated a matrix. To avoid confusion I'm calling the objects 'zero' ... 'nine' (spelled out) and I'm using numerals '1' through '9' as the object's properties.
       0     1     2     3     4     5     6     7     8     9
zero   0.37  0.27  0.23  0.92  0.86  0.62  0.08  0.95  0.35  0.69
one    0.24  0.23  0.70  0.39  0.52  0.03  0.14  0.00  0.53  0.10
two    0.78  0.12  0.85  0.79  0.32  0.90  0.78  0.07  0.07  0.62
...
nine   0.15  0.39  0.27  0.93  0.12  0.14  0.34  0.11  0.72  0.52
So this is my "confusion matrix".
Hierarchical clustering with SciPy. I'm using Euclidean distance, and the single-link agglomerative method.
from scipy.cluster import hierarchy
Y = hierarchy.distance.pdist(data.as_matrix(), metric='euclidean')
Z = hierarchy.linkage(Y, method='single')
ax = hierarchy.dendrogram(Z, show_contracted=True, labels=data.index.tolist())
[I put my matrix in a dataframe so I could add labels to columns and indices. That's why I'm using pandas commands data.as_matrix() to get the raw data, and data.index.tolist() to set the labels.]
This gives: