1

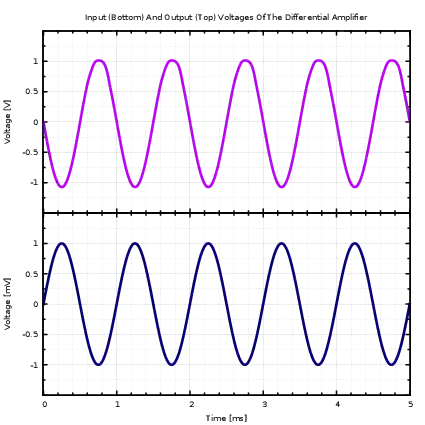
I've plotted the following in Gnuplot. My issue is that the curves exceed the boundary (so we can see that the purple and blue curves go beyond the y-axis). Any way to solve this problem? I'm hoping there is something that restricts drawing to inside the plotting area. Sure I can just plot less of the curve but that then looks weird. Ideally, I want Gnuplot to go around the frame of the curve and remove any bits of the curve that are there.

I've made the purple curve abnormally fat just to illustrate the problem. The problem is also there with the blue curve though.

Graph

The code to produce the above plot is:

#!/usr/bin/env gnuplot

### n: change this parameter to equal the number of data sets to be plotted
n = 2
# t: top margin in pixels
t = 25.0
# b: key height in pixels (bottom margin)
b = 25.0
# h: height of output in pixels
h = 150.0*n + t + b

### define functions to help set top/bottom margins
top(i,n,h,t,b) = 1.0 - (t+(h-t-b)*(i-1)/n)/h
bot(i,n,h,t,b) = 1.0 - (t+(h-t-b)*i/n)/h

### first set up some basic plot parameters
#set term cairolatex size 15cm,15cm
#set output 'DifferentialAmplifierPlot.tex'

set term pdfcairo size 15cm,15cm
set output 'DifferentialAmplifierPlot.pdf'

set border lw 4

set grid mxtics mytics xtics ytics ls '-1' ls '-1' lc rgb 'gray70', lc rgb 'gray90'

set mxtics
set mytics

# Make yrange > ytics > function to get padding.
set yrange [-1.5:1.5]
set ytics ("" -1.5, -1.25 1, -1.0, -0.75 1, -0.5, -0.25 1, 0.0, 0.25 1, 0.5, 0.75 1, 1.0, 1.25 1, "" -1.5)

set xtics 0,1,5
set xrange [0:5]

set xtics
set mxtics
set mytics

set format x ""
set grid xtics ytics mxtics mytics ls -1 ls -1 lc rgb 'gray60', lc rgb '#C0E5E5E5''

set multiplot layout (n+1),1 #font ",14" title 'Input And Output Voltages Of Differential Amplifier'

### First plot
# change only plot command here
currentplot = 1
set tmargin at screen top(currentplot,n,h,t,b)
set bmargin at screen bot(currentplot,n,h,t,b)
unset key
unset xlabel
set title 'Input (Bottom) And Output (Top) Voltages Of The Differential Amplifier'
set ylabel 'Voltage [V]'
plot 'DifferentialAmplfier.dat' using (1000*$1):2 with lines lw 20 lc rgb 'dark-magenta'

### Last plot
# change only plot command here
currentplot = currentplot + 1
set tmargin at screen top(currentplot,n,h,t,b)
set bmargin at screen bot(currentplot,n,h,t,b)
set format x
unset title
set xlabel 'Time [ms]'
set ylabel 'Voltage [mV]'
plot 'DifferentialAmplfier.dat' using (1000*$1):(1000*$3) with lines lw 10 lc rgb 'navy'

unset multiplot

set term x11

Questionable/Dodgy fix...

GraphDodgyFix

Jean-Luc
  • 3,563
  • 8
  • 40
  • 78
  • You can cheat by increasing the border with, but I assume you don't want that... – Bernhard Sep 08 '13 at 12:16
  • Yeah I'd thought of that too, but that does kind of suck, I end up with massive borders. I also thought of drawing a white rectangle over it, but that seems pretty ridiculous. Do you know if there is at least a way to bring the curve to the front layer so it goes over the border? – Jean-Luc Sep 08 '13 at 13:58
  • Actually worked out how to do that... `set border back` – Jean-Luc Sep 08 '13 at 14:15
  • The problem is, that gnuplot does the clipping in the core code, which can respect only the coordinates, and not the shape of the line. That would require massive changes in the code. Still I'm curious about the feedback to you feature request. – Christoph Sep 08 '13 at 14:50
  • Also, I'm trying to set the grid to be behind my curve and the tics to be in front. Is this possible? Gnuplot is a fantastic program, but I don't understand why there are so many weird things that don't work properly. For example, the minor grid lines end up drawn on top of the major grid lines. – Jean-Luc Sep 08 '13 at 15:01
  • Another extremely weird thing is how I am forced to set the major and minor grid options: `set grid mxtics mytics xtics ytics ls -1 ls -1 lc rgb 'gray70', lc rgb 'gray90'`. For some reason, if I put a comma between the `ls -1` as would make sense, it doesn't work. I dunno, it's just weird little things like this that, to me, make Gnuplot really weird. Don't get my wrong, it's great and free, but I just don't get why things like that are like that. – Jean-Luc Sep 08 '13 at 15:10
  • 1
    From time to time also the user makes weird things `;)`. Indeed a comma is required: all before the comma is for the major axes, all behind it is for the minor axes. And `ls -1` doesn't make sense, because `linestyle` are the user-defined styles and must have a number `> 0`. You mean `lt -1`, to which gnuplot falls back in your case. So your grid option is `set grid mxtics mytics xtics ytics lt -1 lc rgb 'gray70', lt -1 lc rgb 'gray90'`. – Christoph Sep 08 '13 at 20:26
  • Haha! Yeah whoops! That was definitely dumb of me! Though is there any way to put tics above curve and grid below? – Jean-Luc Sep 09 '13 at 01:44
  • No, quoted from the docs: `The set grid options 'front', 'back' and 'layerdefault' affect the drawing order of the xtics, too.`. – Christoph Sep 09 '13 at 07:21
  • Yeah, I knew about that, was wondering if there was some workaround. Perhaps I'll post this as a feature request... – Jean-Luc Sep 09 '13 at 08:45
  • @user968243 you can always control the order of drawing by switching functions (e.g. grids) on and off and overdraw using a multiplot with only the part you want drawn at that time, like I have done in my answer below. Your issues with the syntax are understandable, as gnuplot was developed with its own parser, and hence does not comply with standards known from other languages. However, there are interfaces with, for example, python, which you may want to explore. – Andreas Sep 19 '13 at 19:52

1 Answers1

2

There is a way to do this but it is cumbersome. You would use a multiplot, plot your data, then through judicious use of the graph and screen coordinate systems plot white rectangles around your plot, then replot an empty plot to redraw the borders (because the rectangles will have overwritten your labels and half of the border line thickness). Here is an MWE:

#!/usr/bin/gnuplot -persist

reset
f(x) = sin(x)

xl=0; xh=20; yl=-1; yh=1;
set xrange [xl:xh]
set yrange [yl:yh]

set multiplot

plot f(x) not w l lt 3 lw 12

## overdraw borders on left, right, top, bottom
set object 1 rectangle from screen 0, screen 0 to graph 0, screen 1 behind \
  fillstyle solid noborder
set object 2 rectangle from graph 1, screen 0 to screen 1, screen 1 behind \
  fillstyle solid noborder
set object 3 rectangle from screen 0, graph 1 to screen 1, screen 1 behind \
  fillstyle solid noborder
set object 4 rectangle from screen 0, screen 0 to screen 1, graph 0 behind \
  fillstyle solid noborder

plot NaN not

unset multiplot

Edge overdraw example

Andreas
  • 811
  • 7
  • 12
  • 1
    Good catch. This doesn't work for all terminal, the `postscript` terminal doesn't allow `lw 0`, there you must use `fillstyle solid noborder` instead. – Christoph Sep 20 '13 at 08:25
  • Thank @Christoph, I'll change my script accordingly. – Andreas Sep 28 '13 at 14:32
  • The above code doesn't work for `cairolatex`. Any idea why? Thanks. – Jean-Luc Oct 01 '13 at 12:45
  • Please specify what the problem is in cairolatex. I tried it and the overdraw works. However, I see no tic labels. Maybe related to http://sourceforge.net/p/gnuplot/bugs/1086/ – Andreas Oct 03 '13 at 17:34
  • 1
    See the edit in my answer to [Gnuplot: Multiplot Plot Just Curve Without Axis Or Title etc](http://stackoverflow.com/a/19132352/2604213) for an explanation of the different behaviour of `cairolatex` (and `epslatex`) compared to other terminals. – Christoph Oct 10 '13 at 08:03
  • @Christoph, I have tried your edit verbatim and obtain missing axes labels and ticslabels in gnuplot 4.7-0 on kubuntu raring. YMMD depending gnuplot version and build. I'd like to understand this. – Andreas Oct 10 '13 at 22:09
  • 1
    @Andreas I tested it again with 4.6.0, 4.6.3, 4.6.4 and 4.7 (2013-08-01 and 2013-09-23) on Debian and it works with all of them, I run `gnuplot mosfet.gp && pdflatex MosfetClassAbPowerFixed.tex && xpdf MosfetClassAbPowerFixed.pdf`. – Christoph Oct 11 '13 at 06:49
  • @Christoph apologies for wasting your time, I was too rash and assumed that the (include) pdf produced by the gnuplot script was already the result of a `pdflatex` call (from within the gnuplot script). I have now compiled the `.tex` and see all labels in the output. – Andreas Oct 12 '13 at 03:49