6

I have been trying to draw arrows in Matlab in my figure but they all look terrible. Also, I want my arrowhead to be a solid triangle, not a V.

I tried using the packages available on the Matlab File Exchange: arrow, arrows, arrows3, and probably at least one other one.

I even tried manually creating an arrow in the Matlab figure editor, but when I adjust the line width, the arrow looks like this:

enter image description here

I used the annotation command to create the arrow above:

annotation(gcf,'arrow',[0.621875 0.457916666666667],...
                       [0.205421152030217 0.40755429650614],...
                       'HeadLength',4,'LineWidth',5);

Here's the result trying to use the arrow package available here: Arrow.m (notice how the bottom arrow head is not perpendicular to the line:

enter image description here

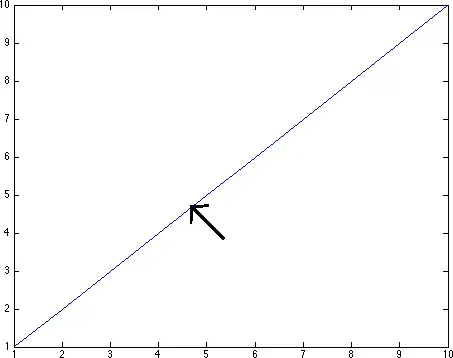
I even tried the following and here is the result below (notice the terrible looking arrowhead):

 figure
 plot(1:10, 1:10)
 annotation(gcf,'arrow',[0.621875 0.457916666666667],...
                        [0.205421152030217 0.40755429650614],...
                        'HeadLength',4,'LineWidth',5);

enter image description here

Veridian
  • 3,531
  • 12
  • 46
  • 80
  • 1
    Spent way way way too much time trying to solve this problem. Best answer so far that I came up with: Download and install Foxit Reader and annotate PDFs in there. – Veridian Aug 13 '13 at 23:42

7 Answers7

4

Vector graphics is hard. Though Matlab's typography is just as bad, but here's a simplistic text-based solution (I refuse to do this sort of annotation in Matlab any more):

figure
plot(1:10, 1:10)
text(5,4,'\rightarrow','FontSize',54,'Rotation',135,...
         'HorizontalAlignment','center');

which yields a figure like this

                        enter image description here

Note that I have used '\leftarrow' because it points in the direction of zero degrees, which makes doing math in my head easier. This is no canned solution, you'll still need to fiddle with position to overcome the fact that Matlab is aligning this as text (see the 'Extent' and 'Margin' properties). Not surprisingly, you may see small glitches. The LaTeX interpreter can be used to obtain a different style arrow head:

    text(5,4,'$\rightarrow$','FontSize',54,'Rotation',135,...
             'HorizontalAlignment','center','Interpreter','latex');

I don't get the small glitches with this option, but the arrows look different (there are likely other LaTeX arrow styles that could be substituted). Changing the font may also have an effect and there are certainly other text-based arrows that could be used. More details on adding arrows can be found in this article from The MathWorks.

horchler
  • 18,384
  • 4
  • 37
  • 73
  • textarrow has the same problems as arrow. – Veridian Aug 13 '13 at 18:02
  • I'd like an arrow shaped like a triangle – Veridian Aug 13 '13 at 18:03
  • It can be done. You just need to use LaTeX (and probably [install additional tex fonts](https://www.mathworks.com/matlabcentral/newsreader/view_thread/283068)). I didn't say would be easy. – horchler Aug 13 '13 at 19:34
  • There is no way to make the arrow LONGER? – Veridian Aug 13 '13 at 21:03
  • You can't have everything. I'd use a font that includes a filled triangle (like the head style you want) and then add the arrow's tail as a line of your desired weight. I've yet to find a satisfying and general solution (for even 2-D arrows) for your question in Matlab. I'd be interested in one myself. It's certainly feasible with vectors, but it'd take work and knowhow. – horchler Aug 13 '13 at 21:16
4

Another solution is to use the open-source Waterloo graphics - a library that addresses this by providing a pure Java library of 2D graphics functions that can easily be integrated in Matlab. See some examples here...

For example, try this code (after properly installing waterloo)

f = GXFigure();
x = -5:0.1:5;
gr1 = gxgca();
a1 = line(gr1, x, cos(x), 'LineSpec','-ob');
b1 = line(gr1, x, sin(x), 'LineSpec','-sg');
annotation(gr1,'arrow',[0.1 0.1],[0.4 0.4],'HeadLength',0.2,'HeadWidth', 0.5, 'LineWidth',2);
gr1.getObject().getView().autoScale();

enter image description here

bla
  • 25,846
  • 10
  • 70
  • 101
  • Thanks, I'm going to look into this. The fonts and everything should still look like regular matlab right? – Veridian Aug 13 '13 at 23:22
  • Exactly how do I draw an arrow? – Veridian Aug 13 '13 at 23:28
  • Thank you, however I want a black arrow, with a tail that maintains it shape when angled at a degree that isn't 0, 90, 180, or 360. – Veridian Aug 22 '13 at 19:35
  • just add `...'color',[ 0 0 0]` to the annotation line. Try to explore other handles to see how to do what you want. – bla Aug 23 '13 at 04:23
3

Having worked with Matlab for more than 10 years and seeing almost zero progress in the quality of the plots (anti-aliased output to bitmap, decent looking eps-files, ...), I decided that my long time solution will be here. Some examples of decent looking arrows here, more beautiful graphs here. Unfortunately, some of the toolboxes prevent me from going completely to numpy/scipy/matplotlib. I know this is more of a rant than an answer, but that is my solution ...

Bas Swinckels
  • 18,095
  • 3
  • 45
  • 62
  • I appreciate your answer sir. I literally just installed this package 1 second ago hah. Now I don't have any idea how to use it. Do I use it with MATLAB or is it standalone? – Veridian Aug 13 '13 at 18:49
  • No, it is not is not standalone, it is the plotting package that goes with `numpy`, which is a library of the [python](http://www.python.org/)-scripting language (a proper object oriented scripting language, with libraries for any task imaginable). Some of Matlab's toolboxes are covered by the [scipy](http://www.scipy.org/)-project. A bit of a learning curve, but well worth it. It is the only open-source alternative to matlab, and almost half my colleagues are using it. Forget octave/scilab, numpy/scipy/matplotlib/ipython is the future ... – Bas Swinckels Aug 13 '13 at 19:09
  • 15+ years here, and sadly, I can only agree. Matlab may be good at computation, but graphics can be a nightmare. From what I've seen of HG2 in real use, the future doesn't necessarily look promising either. – horchler Aug 13 '13 at 19:32
  • I still haven't gotten it installed yet. This is getting to be a huge hassle just to draw a line. Between errors with matplotlib, something called dateutil and ez_setup, this is ridiculous. Is there anywhere with straight forward instructions? – Veridian Aug 13 '13 at 19:59
  • I didnt say this was a solution that will give you your plot tonight, this will take you quite some time to setup and learn. First download and install python and work your way through the tutorial, then install numpy and read its tutorial and 'numpy for matlab users' page. Then install matplotlib and go through some examples. On windows, the easiest way might be to install some ready made python distribution (I used activestate or enthought epd, but that was several years ago). On linux, just use your standard package manager and everything will be ok. – Bas Swinckels Aug 13 '13 at 20:49
  • Okay, so I FINALLY just got it installed in windows and got the figure 1 to display. This is not going to enable me to "just" add arrows to my plots, I would have to completely redesign all of my plots and now my plots won't look consistent. This package would only help if I chose to do all of my graphs in matplotlib (which is out of the question).I wish I would have known this before spending 2 hours trying your solution. – Veridian Aug 13 '13 at 20:51
  • @starbox You should have been tipped of by it being in a different programming language. – tacaswell Aug 14 '13 at 03:37
  • The answer from @natan below uses Waterloo graphics. That now includes Python support as well as MATLAB, R, SciLab etc. Also, by offering an optional Groovy script engine, it allows the same graphics code to run, i.e. no editing, in all of these environments – user1610348 Nov 10 '13 at 12:46
1

Using quiver or quiver3 for 3-D plots will certainly look better than the that last arrow you made using annotation. I'm not sure it will look much better than the ones you made using the Arrow.m package though. It's possible to change the stlyes on quiver as well if you want.

dynamo
  • 57
  • 6
1

I resorted to installing InkScape and drawing arrows in there. Nothing beat the simplicity and quality.

InkScape Website

Veridian
  • 3,531
  • 12
  • 46
  • 80
0

When line-based arrows fail, you can always try patch-based ones:

xArrow = [0 1 1 1.2 1 1 0];               % X-coords of arrow edge points
yArrow = [-0.1 -0.1 -0.2 0 0.2 0.1 0.1];  % Y-coords of arrow edge points
hArrow = fill(xArrow,yArrow, [1 0 0]);    % Plot a red arrow
axis equal                                % Set axis tick marks to be equal

enter image description here

Although more work, you can potentially parameterize the above into a function that takes a number of arguments for adjusting the scaling, aspect ratio, rotation, and position of the arrow. You can even adjust the color, edge line color, and alpha transparency.

This sort of idea appears to have been implemented by François Beauducel in his File Exchange submission ARROWS: generalized 2-D arrows plot.

gnovice
  • 125,304
  • 15
  • 256
  • 359
  • Can you please explain your answer? – Veridian Aug 13 '13 at 17:44
  • I tried the Francois Beauducel file, it had SO many problems with resizing arrows. – Veridian Aug 13 '13 at 18:00
  • @starbox Could you elaborate on what you tried for his submission? – gnovice Aug 13 '13 at 18:03
  • I tried drawing arrows and it didn't function properly, it was horrible. If you can edit your answer with the following parameters and prove to me it works, then I'll try it: Y axis log scaled, x axis domain from 0 to 0.018, y axis from 0 to 300. Arrow rotated downwards from [x,y] = (0.01,140) to about [x,y] = (0.01,100), with a width similar to the arrows I drew in my question. – Veridian Aug 13 '13 at 18:06
  • @starbox Part of your problem is the log-scaling on your y axis. That is going to distort patch-based arrows, which is probably why a number of these solutions are failing. It's probably going to be more complicated to find a general solution that works with log-scaling. – gnovice Aug 13 '13 at 18:14
  • I tried using that arrows package once again, and although I can increase the line width, the arrow head is now invisible for those axis dimensions I gave you. – Veridian Aug 13 '13 at 18:14
  • Anyway to fix that distortion problem? The problem is the axis dimensions, not necessarily the log plot. I tested that. – Veridian Aug 13 '13 at 18:16
  • @starbox I don't have an immediate solution. I'd have to look into it some more. – gnovice Aug 13 '13 at 18:17
  • Even your `patch` arrow seems to have a small line rendering glitch. :-) I love you Matlab. Log scaling is going to make things nearly impossible - maybe use two superimposed and linked axes? – horchler Aug 13 '13 at 19:39
  • Is there anyway to draw my plot and my arrow separate? Like layers? – Veridian Aug 13 '13 at 22:13
0

There is now the DaVinci Draw toolbox (full disclosure: I wrote/sell the toolbox), which uses low-level Matlab commands like plot() and patch() to draw mid-level shapes like arrows. Example syntax:

davinci( 'arrow', 'X',           [0 10],      ...
                  'Y',           [0 2],       ...
                  'Shaft.Width', 1,           ...
                  'Head.Length', 2.5,         ...
                  'Color',       'w',         ...
                  'EdgeColor',   'k',         ...
                  'LineWidth',   2.5 )

From the documentation:

DaVinci arrow

Leonard Wayne
  • 185
  • 1
  • 2
  • 4