0

data is like this:

x,y,z
1.1,2.2,3.3
5.5,1.45,6.77

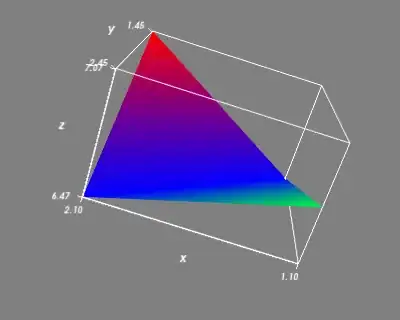
Below is my code which can only plot a plane

import numpy as np
from enthought.mayavi import mlab

x,y,zs =np.loadtxt('test',delimiter=',',usecols=(0,1,2),unpack=True,skiprows=1)
z = np.zeros((len(x), len(x)))
for xi in np.arange(len(x)):
        z[xi, xi] = zs[xi]
pl = mlab.surf(x, y, z, warp_scale="auto")
mlab.axes(xlabel='x', ylabel='y', zlabel='z')
mlab.outline(pl)

This is the effect I look forward to: http://philipp.spitzer.priv.at/notes/attachment/wiki/PythonPlotting/PythonPlottingSurf.png

ali_m
  • 71,714
  • 23
  • 223
  • 298
questionhang
  • 735
  • 2
  • 12
  • 31

1 Answers1

1

It seems to work OK to me:

enter image description here

Is that not what you were expecting?

ali_m
  • 71,714
  • 23
  • 223
  • 298
  • You used exactly the same code as above?I want to make a surface plot.The effect is in that link.You points are rare?My points are in one plane.It is weird. – questionhang Aug 08 '13 at 15:57
  • I had to make a couple of very minor edits to the code you originally posted (there was a `` HTML tag left in for some reason, and I had to add `skiprows=1` to the arguments to `np.loadtxt` in order to make it skip the `x,y,z` on the first line of `test`). I also used `from mayavi import mlab`, since I'm not using the Enthought Python Distribution. – ali_m Aug 08 '13 at 16:57
  • Thank you.You can add more points if you have time.My points are still in one plane.I'll make a new post and ask again. – questionhang Aug 09 '13 at 03:15
  • You should modify this post rather than starting a new one (unless you have a separate question to ask). – ali_m Aug 09 '13 at 09:55