Hmm....
So let's plot:
x = zeros(1,21); y = -10:10; z = y/2;
figure; plot3(x,y,z); % a line from (0,-10,-5) to (0,10,5) similar to the example
Well, one problem is that matlab doesn't automatically plot the coordinate axis as you've shown there.
This is discussed here:
How to show x and y axes in a MATLAB graph?
To plot those (in 3D), a cheap solution is:
locs = axis; % get current axis boundaries
hold on;
plot3([locs(1) locs(2)], [0 0], [0 0]); %plot xaxis, a line between(-x,0,0) and (x,0,0);
plot3([0 0], [locs(3) locs(4)], [0 0]); %plot y axis, the line (0,-y,0) and (0,y,0);
plot3([0 0], [0 0], [locs(5) locs(6)]); % plot z axis
hold off

Just like that Gnu plot, the 3D matlab plot is "in a box." Unlike the Gnu plot, the matlab box isn't outlined. If you want to outline that you'll have to draw those lines too...ugh.
% lets plot the 12 lines to make this box in black ('k');
hold on;
% hold x constant and plot 4 parallel-to-x lines;
plot3([locs(1) locs(2)], [locs(3) locs(3)], [locs(5) locs(5)],'k'); % (-x,-y,-z) to (x,-y,-z)
plot3([locs(1) locs(2)], [locs(3) locs(3)], [locs(6) locs(6)],'k');
plot3([locs(1) locs(2)], [locs(4) locs(4)], [locs(5) locs(5)],'k');
plot3([locs(1) locs(2)], [locs(4) locs(4)], [locs(6) locs(6)],'k');
% plot parallel-to-y lines
plot3([locs(1) locs(1)], [locs(3) locs(4)], [locs(5) locs(5)],'k');
plot3([locs(1) locs(1)], [locs(3) locs(4)], [locs(6) locs(6)],'k');
plot3([locs(2) locs(2)], [locs(3) locs(4)], [locs(5) locs(5)],'k');
plot3([locs(2) locs(2)], [locs(3) locs(4)], [locs(6) locs(6)],'k');
% plot parallel-to-z lines
plot3([locs(1) locs(1)], [locs(3) locs(3)], [locs(5) locs(6)],'k');
plot3([locs(1) locs(1)], [locs(4) locs(4)], [locs(5) locs(6)],'k');
plot3([locs(2) locs(2)], [locs(3) locs(3)], [locs(5) locs(6)],'k');
plot3([locs(2) locs(2)], [locs(4) locs(4)], [locs(5) locs(6)],'k');
hold off;
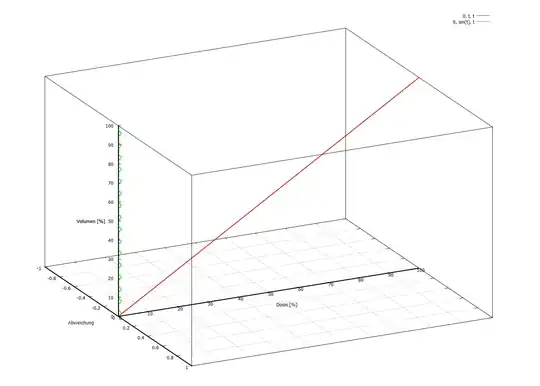
Now we have the box;

If we want just the area y>0,z>0; we can use the axis command.
Using axis after plotting all those other lines really messed everything up for me, so I would decide on your limits at the beginning.
All together:
figure;
plot3(x,y,z); % a line from (0,-10,-5) to (0,10,5) similar to the example
locs = axis;
axis([locs(1) locs(2) 0 locs(4) 0 locs(6)]);
locs = axis;

hold on;
% plot axis
plot3([locs(1) locs(2)], [0 0], [0 0]); %plot xaxis, a line between(-x,0,0) and (x,0,0);
plot3([0 0], [locs(3) locs(4)], [0 0]); %plot y axis, the line (0,-y,0) and (0,y,0);
plot3([0 0], [0 0], [locs(5) locs(6)]); % plot z axis

% plot box
% hold x constant and plot 4 parallel-to-x lines;
plot3([locs(1) locs(2)], [locs(3) locs(3)], [locs(5) locs(5)],'k'); % (-x,-y,-z) to (x,-y,-z)
plot3([locs(1) locs(2)], [locs(3) locs(3)], [locs(6) locs(6)],'k');
plot3([locs(1) locs(2)], [locs(4) locs(4)], [locs(5) locs(5)],'k');
plot3([locs(1) locs(2)], [locs(4) locs(4)], [locs(6) locs(6)],'k');
% plot parallel-to-y lines
plot3([locs(1) locs(1)], [locs(3) locs(4)], [locs(5) locs(5)],'k');
plot3([locs(1) locs(1)], [locs(3) locs(4)], [locs(6) locs(6)],'k');
plot3([locs(2) locs(2)], [locs(3) locs(4)], [locs(5) locs(5)],'k');
plot3([locs(2) locs(2)], [locs(3) locs(4)], [locs(6) locs(6)],'k');
% plot parallel-to-z lines
plot3([locs(1) locs(1)], [locs(3) locs(3)], [locs(5) locs(6)],'k');
plot3([locs(1) locs(1)], [locs(4) locs(4)], [locs(5) locs(6)],'k');
plot3([locs(2) locs(2)], [locs(3) locs(3)], [locs(5) locs(6)],'k');
plot3([locs(2) locs(2)], [locs(4) locs(4)], [locs(5) locs(6)],'k');
hold off;

I'm sure you can make it better, but I think that's a really good start. I would put all that mess into a function to save the typing.