3

I am trying to subset the SpatialGrid with 1 polygon present in class SpatialPolygons. How can I do this?

I tried it this way:

grd.clip <- grd[!is.na(over(grd, polygon))]

But I get error

Error in matrix(idx, gr@cells.dim[2], gr@cells.dim[1], byrow = TRUE)[rows,  : 
  (subscript) logical subscript too long
Charles
  • 50,943
  • 13
  • 104
  • 142
Tomas
  • 57,621
  • 49
  • 238
  • 373

3 Answers3

4

I've tried a way that turn out not to be the desired solution. I'll keep it here for illustrate my original idea but I'll willing to delete it if necessary

The solution to the initial question still not clear to me but I'll make it better if necessary

library(sp)
library(rgdal)
library(raster)
library(latticeExtra)

Load shapefile

shp <- readOGR(dsn = "D:/Programacao/R/Stackoverflow/17962821", layer = "shp")
proj4string(shp)

create a Grid topology

grid <- GridTopology(cellcentre.offset=c(731888.0,7457552.0),
                     cellsize=c(16,16),cells.dim=c(122,106))
grid <- SpatialGrid(grid, proj4string=CRS(proj4string(shp)))

Convert SpatialGrid to rasterLayer

rgrid <- raster(extent(grid))
res(rgrid) <- c(16, 16)

Give it some numbers

rgrid[] <- runif(ncell(grid), 1, 10)
proj4string(rgrid) <- CRS(proj4string(shp))
plot(rgrid)

rgrid

Mask the raster with the SPDF

rgrid_msk <- mask(rgrid,shp)
plot(rgrid_msk)

rgrid_msk

Convert it back to grid retaining attribute values

grid_ae <- as(rgrid_msk, 'SpatialPointsDataFrame')
grid_ae <- grid_ae[!is.na(grid_ae@data$layer), ]
gridded(grid_ae) <- TRUE
summary(grid_ae)

> summary(grid_ae)
Object of class SpatialPixelsDataFrame
Coordinates:
      min     max
x  731912  733816
y 7457560 7459224
Is projected: TRUE 
proj4string :
[+proj=utm +zone=22 +south +ellps=aust_SA +units=m +no_defs]
Number of points: 7814
Grid attributes:
  cellcentre.offset cellsize cells.dim
x            731920       16       119
y           7457568       16       104
Data attributes:
   Min. 1st Qu.  Median    Mean 3rd Qu.    Max. 
  1.005   3.231   5.523   5.512   7.748   9.999 

spplot(grid_ae) +
  latticeExtra::layer(sp.polygons(shp, fill = NA, col = 'red'))

grid_ae

The solution to preserve attributes of a SPDF after intersect it with a regular area

library(rgeos)
library(rgdal)
library(sp)
library(latticeExtra)
grid <- readOGR(dsn = 'S:/Temporarios', layer = 'grid')
proj4string(grid) <- CRS('+init=epsg:4326')

grid

class       : SpatialPolygonsDataFrame 
features    : 110 
extent      : -9.6, -7.95, 36.45, 37.95  (xmin, xmax, ymin, ymax)
coord. ref. : +init=epsg:4326 +proj=longlat +datum=WGS84 +no_defs +ellps=WGS84 +towgs84=0,0,0 
variables   : 1
names       :  ID 
min values  : 652 
max values  : 761

summary(grid@data)
       ID       
Min.   :652.0  
1st Qu.:679.2  
Median :706.5  
Mean   :706.5  
3rd Qu.:733.8  
Max.   :761.0  

polyg <- readOGR(dsn = 'S:/Temporarios', layer = 'polyg')
proj4string(polyg) <- CRS('+init=epsg:4326')

# plot it
spplot(grid, 'ID') +
  latticeExtra::layer(sp.polygons(polyg, fill = NA, col = 'blue'))´

plot layers

# clip 
clipgrid <- gIntersection(grid, polyg, byid = T, id = as.character(grid@data$ID))
cells <- row.names(clipgrid)
cells <- split(cells, ' ')
clipspdf <- as(clipgrid, 'SpatialPolygonsDataFrame')
clipspdf@data$id <- as.numeric(row.names(clipspdf@data))
spplot(clipspdf, 'id')

plot clip

summary(clipspdf@data)
     dummy         id       
 Min.   :0   Min.   :665.0  
 1st Qu.:0   1st Qu.:687.8  
 Median :0   Median :706.5  
 Mean   :0   Mean   :706.4  
 3rd Qu.:0   3rd Qu.:725.2  
 Max.   :0   Max.   :747.0  

Download data from this Dropbox

Paulo E. Cardoso
  • 5,778
  • 32
  • 42
1

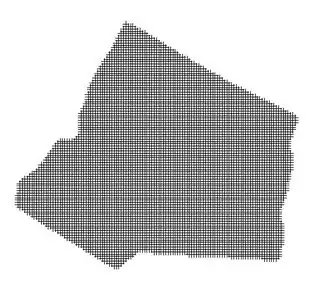
The following R code works (notice the missing , in your example), some objects you need to run this code are given at the end of this answer:

meuse.grid[!is.na(over(meuse.grid, sr)),]

If this does not solve your problem, please provide a reproducible example that illustrates the issue.

Some objects needed:

 r1 = cbind(c(180114, 180553, 181127, 181477, 181294, 181007, 180409, 
 180162, 180114), c(332349, 332057, 332342, 333250, 333558, 333676, 
 332618, 332413, 332349))
 r2 = cbind(c(180042, 180545, 180553, 180314, 179955, 179142, 179437, 
 179524, 179979, 180042), c(332373, 332026, 331426, 330889, 330683, 
 331133, 331623, 332152, 332357, 332373))
 r3 = cbind(c(179110, 179907, 180433, 180712, 180752, 180329, 179875, 
 179668, 179572, 179269, 178879, 178600, 178544, 179046, 179110),
 c(331086, 330620, 330494, 330265, 330075, 330233, 330336, 330004, 
 329783, 329665, 329720, 329933, 330478, 331062, 331086))
 r4 = cbind(c(180304, 180403,179632,179420,180304),
 c(332791, 333204, 333635, 333058, 332791))

 sr1=Polygons(list(Polygon(r1)),"r1")
 sr2=Polygons(list(Polygon(r2)),"r2")
 sr3=Polygons(list(Polygon(r3)),"r3")
 sr4=Polygons(list(Polygon(r4)),"r4")
 sr=SpatialPolygons(list(sr1,sr2,sr3,sr4))
 srdf=SpatialPolygonsDataFrame(sr, data.frame(cbind(1:4,5:2), row.names=c("r1","r2","r3","r4")))

 data(meuse)
 coordinates(meuse) = ~x+y

 data(meuse.grid)
 gridded(meuse.grid) = ~x+y
Paul Hiemstra
  • 59,984
  • 12
  • 142
  • 149
0

Here is what I came up with, after the bounty:

require(sp)
require(rgdal)

grid = GridTopology(cellcentre.offset=c(731888.0,7457552.0),cellsize=c(16,16),cells.dim=c(122,106))
# convert object of class SpatialGrid to SpatialPixelsDataFrame. 
grid = SpatialPixelsDataFrame(grid,
                          data=data.frame(id=1:prod(122,106)),
                          proj4string=CRS(proj4string(shp)))
plot(grid)

enter image description here

shp = readOGR(dsn = "...", layer = "shp")
bound = shp@polygons
bound = SpatialPolygons(bound, proj4string=CRS("+proj=utm +zone=22 +south +ellps=aust_SA +units=m +no_defs"))
plot(bound)

enter image description here

Credits to Paul Hiemstra's answer.

clip_grid = grid[!is.na(over(grid, bound)),]
plot(clip_grid)

enter image description here

Andre Silva
  • 4,782
  • 9
  • 52
  • 65