0

I have generated a random set of data here, as I cannot post my own. It's not great data but it should illustrate what I'm trying to do.

Specifically, I have three treatments, the effects of which are being measured each year. Each treatment is replicated 6 times each year.

I want to plot the effect of treatment on the Dependent variable (DV) with year (i.e. over the course of the study) using ggplot2

I have tried:

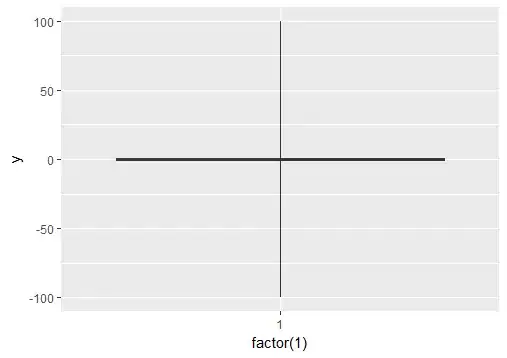
ggplot(test, aes(x = factor(Year), y = DV, fill = factor(Grp))) + 
geom_boxplot()

Which works well for this random data I have generated, but for my actual data the size of the boxes are much more variable and the graph is very difficult to interpret. What I wanted to do to simplify things, was to instead plot the treatment means with year (rather than using the boxes), and add standard errors to these treatment means. I also want to join up these treatment means with a straight line between each treatment's mean in each year. Does anyone know of a way to do this?

Thanks in advance!

Julius Vainora
  • 47,421
  • 9
  • 90
  • 102
Sarah
  • 789
  • 3
  • 12
  • 29

1 Answers1

4

One way is to recalculate mean and sd values before plotting in new data frame. Another way would be to define own stat_ function. Here is modified example from stat_summary() help page. This will calculate mean and confidence interval for each treatment in each year and plot it as geom="pointrange". Lines are added with stat_summary() and geom="line".

stat_sum_df <- function(fun, geom="crossbar", ...) {
      stat_summary(fun.data=fun, geom=geom, width=0.2, ...)
  }

ggplot(test, aes(x = factor(Year), y = DV, colour=Grp,group=Grp)) + 
  stat_sum_df("mean_cl_normal",geom="pointrange")+
  stat_summary(fun.y="mean",geom="line")

enter image description here

Update

To get standard errors you have to make new function. I named it stat_mean_sd(). Now use this function inside stat_summary().

stat_mean_sd<-function(x){
  cal.df<-data.frame(
    y=mean(x),
    ymin=mean(x)-sd(x)/sqrt(length(x)),
    ymax=mean(x)+sd(x)/sqrt(length(x)))
  return(cal.df)
}

ggplot(test, aes(x = factor(Year), y = DV, colour=Grp,group=Grp)) + 
  stat_summary(fun.data=stat_mean_sd,geom="pointrange")+
  stat_summary(fun.y="mean",geom="line")

enter image description here

Didzis Elferts
  • 95,661
  • 14
  • 264
  • 201
  • Thank you. Is there a way to get Standard errors (+/-1SE) rather than confidence intervals? – Sarah Jul 15 '13 at 18:20
  • Ah, set the geom to geom="errorbar". It doesn't specify what these error bars represent though... – Sarah Jul 15 '13 at 18:23