2

I'm working through the charting and comparing prices tutorial on tryfsharp.org and my Chart.Combine function in Fsharp.Charting library will not work, but, other charts, such as Chart.Line will work! Code below.

// Helper function returns dates & closing prices from 2012
let recentPrices symbol = 
    let data = stockData symbol (DateTime(2012,1,1)) DateTime.Now
    [ for row in data.Data -> row.Date.DayOfYear, row.Close ]


Chart.Line(recentPrices "AAPL", Name="Apple") //These two guys work when I try to plot them.
Chart.Line(recentPrices "MSFT", Name="Microsoft")

Chart.Combine( // This guy will not plot. Syntax found here: http://fsharp.github.io/FSharp.Charting/PointAndLineCharts.html
   [ Chart.Line(recentPrices "AAPL", Name="Apple")
     Chart.Line(recentPrices "MSFT", Name="Microsoft")])
Tomas Petricek
  • 240,744
  • 19
  • 378
  • 553
Ian Leatherbury
  • 364
  • 4
  • 11
  • I'd expect your script having a semicolon between the elements of the combined list, like this `...Name="Apple");` – Gene Belitski Jul 01 '13 at 18:38
  • Thanks for responding. I tried the semi-colon as suggested, and it seemed to make no difference. The code compiled, and returned no error, but the graph did not show either. – Ian Leatherbury Jul 01 '13 at 18:49
  • Right, for the list comprehension it doesn't matter newline, or semicolumn is separating list members. Nevertheless, my smoke test for combination of `ChartTypes.GenericChart` works perfectly, so the problem might be in your data generation function, when used subsequently. – Gene Belitski Jul 01 '13 at 21:31
  • Going through the tutorial works perfectly for me, as does pasting your code directly in to the browser editor and running. When you say `Chart.Combine` "doesn't work," what do you mean exactly? Is there an error message? What browser are you using? – latkin Jul 01 '13 at 22:15

1 Answers1

2

I'd suggest you substituting your data generator function with something simpler and achieving correct plotting with this mockup first. For example, the following script:

#load @"<your path here>\Fsharp.Charting.fsx"
open System
open FSharp.Charting

let rand = System.Random
let recentPricesMock symbol =
    [for i in 1..12 -> DateTime(2012,i,1),rand.Next(100)]
Chart.Combine (
    [ Chart.Line(recentPricesMock "AAPL", Name="Apple")
      Chart.Line(recentPricesMock "MSFT", Name="Microsoft")])

must plot combined mockup chart without any problems, as it does on my local box. From here you may drill down for the cause of original problem comparing your recentPrices with recentPricesMock.

EDIT: after getting to the full problematic source code I can point out two problems there that, as I was expecting, are in your choice of data rather, than in charting per se:

First, your definition of recentPrices converts dates into sequential day of year (row.Date.DayOfYear), so transition from 2012 into 2013 messes up your data and, consequently, charts. If you want to preserve your current functionality then it makes sense to redefine recentPrices as below

let recentPrices symbol =
    let data = stockData symbol (DateTime(2012,1,1)) DateTime.Now
    [ for row in data.Data -> row.Date, row.Close ]

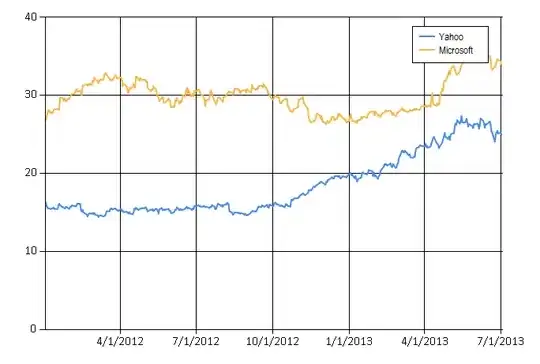
Second, you chose a pair of stocks that doesn't scale well being combined on the single chart (AAPL in high hundreds $$, while MSFT in low tens $$), which adds to repetition of data points from first problem. After changing in your code AAPL to YHOO in addition to the recentPrices definition change described above

Chart.Combine ([
            Chart.Line(recentPrices "YHOO", Name="Yahoo")
            Chart.Line(recentPrices "MSFT", Name="Microsoft")
            ])

yields a beautiful smooth chart combo: combochart

Gene Belitski
  • 10,270
  • 1
  • 34
  • 54
  • Should point out that this relies on the FSharpChart library (http://code.msdn.microsoft.com/windowsdesktop/FSharpChart-b59073f5), and can't be run via TryFSharp.org, as OP seems to be doing. – latkin Jul 01 '13 at 22:13
  • @latkin: Not really; code using `Fsharp.Charting` successfully runs via TryFSharp.org, check [this tutorial](http://www.tryfsharp.org/Learn/data-visualization#quick-start) from there that uses `Chart.Combine` combinator among other charting functions. – Gene Belitski Jul 01 '13 at 23:57
  • You suggest `#load` of an fsx, this is not possible in TryF#. – latkin Jul 02 '13 at 00:10
  • @latkin: I specifically pointed *on my local box* for `#load` assuming fsi script run. For run under `TryFSharp` library references differ, for run as standalone app - further differ. But this is besides the point as question does not indicate any trouble with successfully visualizing single series and author apparently knows how to handle his environment. – Gene Belitski Jul 02 '13 at 00:30
  • Hi guys, thanks again for your responses. @latkin, sorry I should have mentioned, I am running on my local machine, porting everything from the website over to Vis Studio. Gene, I'll give the code a try. I am able to use Chart.Combine in one of the other projects, so I think you are right in saying it has something to do with the data generation. Will get back once I have time to play! – Ian Leatherbury Jul 02 '13 at 19:18
  • Gene, I tried that code and after a little bit of modification for use with the MathNet library it worked. `let rand = Distributions.Normal() let recentPricesMock symbol = [for i in 1..12 -> DateTime(2012,i,1),rand.Sample()] Chart.Combine ( [ Chart.Line(recentPricesMock "AAPL", Name="Apple") Chart.Line(recentPricesMock "MSFT", Name="Microsoft")])` (For some reason rand.next threw and error: Invalid use of a type name and/or object constructor. If necessary use 'new' and apply the constructor to its arguments, e.g. 'new Type(args)'. – Ian Leatherbury Jul 02 '13 at 22:52
  • @GeneBelitski Sorry for the crappy formatting, still getting the hang of SO. A full breakdown of the code, and problem can also be found here: http://ianleatherbury.wordpress.com/2013/07/02/charting-and-comparing-prices-trouble-with-chart-combine/ I'll see what else I can do to figure this out. Thanks for the help! – Ian Leatherbury Jul 02 '13 at 23:01
  • @GeneBelitski Thanks for the great help! The first issue is completely solved, the graphs look perfect separately. Regarding the second issue, I am still not able to get a graph out of Chart.Combine! I am baffled. I don't know what could be the issue. I am able to use Chart.Combine in other projects with no problem! I am about to say forget it, since I am able to use it on other projects, but I am still perplexed as to why it does not work! – Ian Leatherbury Jul 03 '13 at 23:40