5

I've been trying to follow the instructions here to set the color of many lines along a grayscale using floats from 0. (white) to 1. (black). The function line.set_color() accepts the floats, but the error below appears when I do plt.show():

ValueError: to_rgba: Invalid rgba arg "1.0"
to_rgb: Invalid rgb arg "1.0"
cannot convert argument to rgb sequence

In this answer it is explained how to do that using plt.cm.RdYlBu(i). Is there any equivalent for grayscale?
Community
  • 1
  • 1
Saullo G. P. Castro
  • 56,802
  • 26
  • 179
  • 234
  • Do you simply want to construct a white-to-black colormap? – Bitwise Jun 21 '13 at 15:53
  • 2
    Sure, just `plt.cm.gray` (or `plt.cm.gray_r` if you want it going the other way. See the colormaps here: http://matplotlib.org/examples/pylab_examples/show_colormaps.html – Joe Kington Jun 21 '13 at 15:54
  • 4
    Also, the error is because matplotlib uses _strings_ of floats to indicate grayscale instead of actual floats. So you'd pass in `'0.5`' instead of `0.5`. (That's one of the more confusing corners of things. It's for reasons I won't get into here, but it's a common gotcha. There's no technical reason why it can't just accept a single float--it's just historical.) – Joe Kington Jun 21 '13 at 15:57
  • Thank you! you could add this comment as the answer... – Saullo G. P. Castro Jun 21 '13 at 15:58

1 Answers1

12

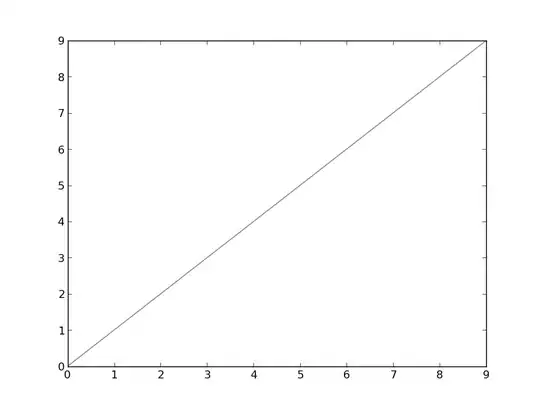
For historical reasons, matplotlib expects "floats" to be interpreted as grayscale values to be passed in as strings, which is the reason for your error.

For example:

import matplotlib.pyplot as plt

fig, ax = plt.subplots()
ax.plot(range(10), color="0.5")
plt.show()

enter image description here

Also, for a grayscale colormap, just use plt.cm.gray or plt.cm.gray_r (reversed). There's a full list of colormaps here: http://matplotlib.org/examples/pylab_examples/show_colormaps.html

Joe Kington
  • 275,208
  • 71
  • 604
  • 463