9

When viewing my remote application in JVisualVM over JMX, I see a saw-tooth of memory usage while idle:

enter image description here

Taking a heap dump and analysing it with JVisualVM, I see a large chunk of memory is in a few big int[] arrays which have no references and by comparing heap dumps I can see that it seems to be these that are taking the memory and being reclaimed by a GC periodically.

I am curious to track these down since it piqued my interest that my own code never knowingly allocates any int[] arrays.

I do use a lot of libs like netty so the culprit could be elsewhere. I do have other servers with much the same mix of frameworks but don't see this sawtooth there.

How can I discover who is allocating them?

Will
  • 73,905
  • 40
  • 169
  • 246
  • Take into consideration that, even though you don't literally have `new int[]`, you may still be allocating these yourself. An array is theoretically the only large thing one can allocate in Java. – Marko Topolnik Jun 17 '13 at 10:28
  • 1
    @MarkoTopolnik yes, being a netty server, I do have some `byte[]` around that I can account for. Its these large temporary `int[]` that I'm curious about, even though I understand they get reclaimed as soon as there's a GC; they might cause GCs more frequently than I'd like, but they don't seem to affect the server otherwise luckily. I'm just curious how you'd go about debugging it. – Will Jun 17 '13 at 10:33
  • 2
    [This link](http://stackoverflow.com/a/12017652/1103872) should be of help. – Marko Topolnik Jun 17 '13 at 10:36
  • @MarkoTopolnik thx. Sadly the memory profiler is not available when the JVM is remote, but it was a very good lead. I don't see the sawtooth when running the server locally but then many of its connections have to be mocked so its not a 1:1 environment. Shame; thx for digging! – Will Jun 17 '13 at 10:40
  • 7
    I don't know if it's just that, but the repeated, remote polling via JMX *itself* will create garbage (we've observed this by measuring the memory usage via in-process and out-of-process means). This means that you *could* just be viewing that while your actual program doesn't produce any garbage (or not a lot). – Joachim Sauer Jun 17 '13 at 10:42
  • @JoachimSauer I think that's dead on, especially if you notice that the period between GC's in that image is about 9 minutes, so we're talking about ~100 MB / 9*60 secs = 185 KB/s. – Marko Topolnik Jun 17 '13 at 11:14

2 Answers2

3

Take a heapdump and find out what objects are holding them. Once you know what objects are holding the arrays you should have an easy time idea figuring out what is allocating them.

It doesn't answer your question, but my question is:

Why do you care?

You've told the jvm garbage collector (GC) it can use up to 1GB of memory. Java is using less than 250M.

The GC tries to be smart about when it garbage collects and also how hard it works at garbage collection. In your graph, there is no demand for memory. The jvm isn't anywhere near that 1GB limit you set. I see no reason the GC should try very hard at all. Not sure why you would care either.

Its a good thing for the garbage collector to be lazy. The less the GC works, the more resources there are available for your application.

Have you tried triggering GC via the JVisualVM "Perform GC" button? That button should trigger a "stop the world" garbage collection operation. Try it when the graph is in the middle of one of those saw tooth ramp ups - I predict that the usage will drop to the base of the saw tooth or below. If it does, that proves that the memory saw tooth is just garbage accumulation and GC is doing the right thing.

Here is an screenshot of memory usage for a java swing application I use: enter image description here

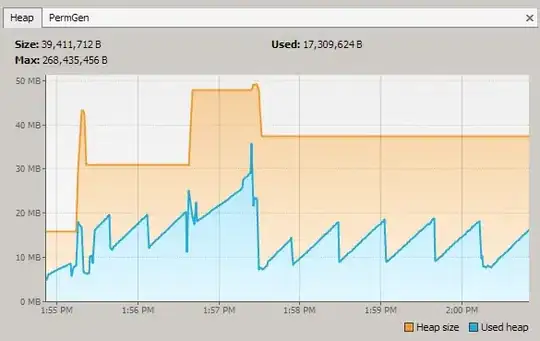
Notice the sawtooth pattern.

You said you are worried about int[]. When I start the memory profiler and have it profile everything I can see the allocations of int[]

enter image description here

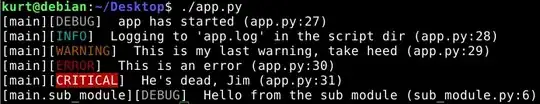
Basically all allocations come from an ObjectOutputStream$HandleTable.growEntries method. It looks like the thread the allocations were made on was spun up to handle a network message.
I suspect its caused by jmx itself. Possibly by rmi (do you use rmi?). Or the debugger (do you have a debugger connected?).

Ryan
  • 2,061
  • 17
  • 28
  • Thx for the thoughtful answer, Ryan. When I said they have no references, I meant I can't see who is holding them - nobody is. They are garbage. I have not yet managed to snapshot while they are still held by someone. So the question is, who is creating them and why? And how would you track it down? Regards the bigger question, I am heap profiling my app because under load it is using far more memory than I like and I face all kinds of out-of-memory reports from users in the field. So seeing this sawtooth while idle is interesting to track down. – Will Jun 18 '13 at 05:14
  • Also, your stack traces are very very interesting, and its neat you can see the object stream in there. I don't have a memory profiler because all my servers, even test ones, are 'remote' and that's a jvisualvm limitation. – Will Jun 18 '13 at 05:17
  • @Will - You really have got to analyze a heapdump of the application when it runs out of memory - you aren't going to get very far looking at the application when it isn't under load. -XX:+HeapDumpOnOutOfMemoryError is hugely helpful. The standalone Eclipse Memory Analyser is also a great free tool. – Ryan Jun 18 '13 at 16:09
  • yes well understood. Its more that without memory profiling, how can you determine from a heap dump who allocated some garbage that has no references? Its a very general question, and the answer seems to be that it *isn't possible* :/ – Will Jun 19 '13 at 05:24
1

I just thought I'd add to this question that the sawtooth pattern is very much normal and has nothing necessarily to do with your int[] arrays. It happens because new allocations happen in the Eden-gen, and an ephemeral collection only is triggered once it has filled up, leaving the old-gen be. So as long as your program does any allocations at all, the Eden gen will fill up and then empty repeatedly. Especially, then, when you have a regular amount of allocations per unit of time, you'll see a very regular sawtooth pattern.

There are tons of articles on the web detailing how Hotspot's GC works, so there's no need for me to expand on that here. If you don't know at all how ephemeral collection works, you may want to check out Wikipedia's article on the subject (see the "Generational GC" section; "generational" and "ephemeral" are synonymous in this context).

As for the int[] arrays, however, they are a bit mysterious. I'm seeing those as well, and there's another question here on SO on the subject of them without any real answer. It's not actually normal for objects with no references to show up in a heap dump, because a heap dump normally only contains live objects (because Hotspot always performs a stop-the-world collection before actually dumping the heap). My personal guess is that they are allocated as part of some kind of internal JVM data-structure (and therefore only have references from the C++ part of Hotspot rather than from the Java heap), but that's really just a pure guess.

Community
  • 1
  • 1
Dolda2000
  • 25,216
  • 4
  • 51
  • 92