I have the following code:
figure;
contour(X1,X2,f);

hold on

plot(top(1:size(top,1)), 'rx');
EDIT
    figure;
for i = 1: G
    contour(X1,X2,f);

    hold on

    plot(top(1:size(top,1)), 'rx');
end
NB: G is the maximum generation.
This is supposed to plot contours of sphere superimposed with selected individuals. In each iteration of the individuals, the best individuals is selected and these going on until the global optimum is reached. I need to show this in a movie form as shown in this below:
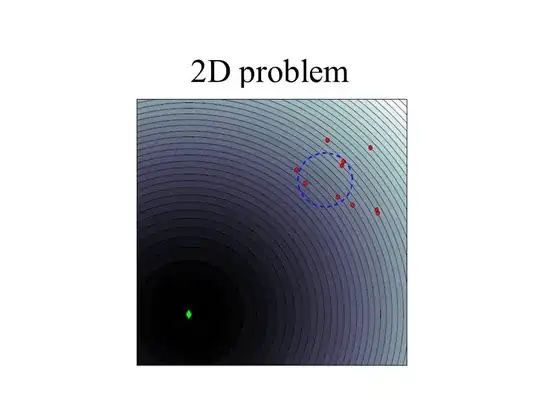
![slides 1![][1]](../../images/3821931636.webp)


When you runs each stage of the iteration is indicated in the slides attached. This is what i am trying to do. Any idea please?