0

In python, with matplotlib, I have to draw 2 CDF curves on the same plot: one for data A, one for data B.

If I were to decide the "binning" myself, I would do the following and take 100 histograms based on data A. (in my case, A is always at most 50% of the size of B)

import numpy as np
import matplotlib

fig = plt.figure()
ax = fig.add_subplot(1, 1, 1)
ax.grid(True)

a = 0
nhist = 100                
b = np.max(samplesFromA)
c = b-a
d = float(c) / float(nhist)  #size of each bin
# tmp will contain a list of bins:  [a, a+d, a+2*d, a+3*d, ... b]
tmp = [a]
for i in range(nhist):
    if i == a:
    continue
    else:
    tmp.append(tmp[i-1] + d)

#  CDF of A 
ax.hist(samplesFromA, bins=tmp, cumulative=True, normed=True,
        color='red', histtype='step', linewidth=2.0,
        label='samples A')

# CDF of B
plt.hist(samplesFromB, bins=tmp, cumulative=True, normed=True,
        color='blue', alpha=0.5, histtype='step', linewidth=1.0,
        label='samples B')

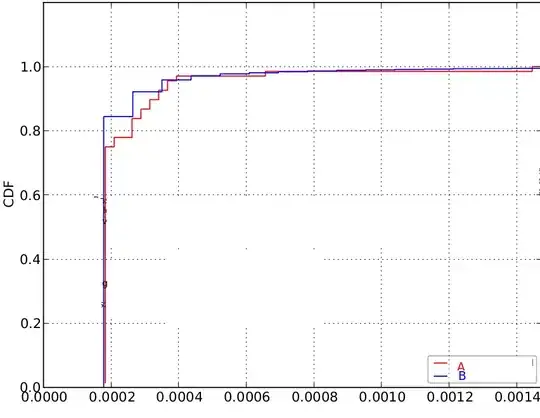
Here is the result (I cropped out all the non-relevant information): enter image description here

Recently I've found out about sm.distributions.ECDF, which I wanted to compare to my previous implementation. Basically, I will just call the following function on my data (and decide elsewhere the the range of the rightmost bin), without computing any bins:

def drawCDF(ax, aSample):
    ecdf = sm.distributions.ECDF(aSample)
    x = np.linspace(min(aSample), max(aSample))
    y = ecdf(x)
    ax.step(x, y)
    return ax

Here is the result, with the same data (again, I manually cropped out non-relevant text): enter image description here

It turns out that this last example merges too many bins together and the result isn't a very well fine-grained CDF curve. What exactly happens behind the scenes here?

Sample A (in red) contains 70 samples, while sample B (in blue) contains 15 000!

Ricky Robinson
  • 21,798
  • 42
  • 129
  • 185

1 Answers1

1

I suggest you read the source.

if you want evenly spaced bins:

x = np.linspace(min(aSample), 
                max(aSample),
                int((max(aSample) - min(aSample)) / step))

np.arange doc

tacaswell
  • 84,579
  • 22
  • 210
  • 199
  • Thanks. On a second thought, I think I just didn't know exactly what `numpy.linspace()` was doing. Still my fault, of course. :) From the [documentation] (http://docs.scipy.org/doc/numpy/reference/generated/numpy.linspace.html), `numpy.linspace(start, stop, num=50, endpoint=True, retstep=False)` will always generate 50 evenly spaced numbers over the given interval. Those are the 'bin ranges' over which I am applying my ECDF. So I think I will have to specify that `num` parameter, but I'm a bit clueless on which value to take, depending on the size of my data. Any idea? – Ricky Robinson May 29 '13 at 22:28
  • Thanks! In the documentation it says that `arange` is for integers, whereas floats need `linespace`. I guess we are back to my first comment. :) – Ricky Robinson May 29 '13 at 23:06
  • I also suspect that 'inconsistent' here only really matters when you are doing detailed numerics. – tacaswell May 29 '13 at 23:12
  • Thanks! Any advice on the value for `step`? Should I use the normal reference rule or something similar? http://en.wikipedia.org/wiki/Histogram#Number_of_bins_and_width – Ricky Robinson May 29 '13 at 23:16
  • 1
    that is between you and your data. – tacaswell May 29 '13 at 23:19
  • Actually, if I really want to see what this `ecdf` looks like, I think I need as many histograms as possible. They will just have the same value and result visually in a step whenever it is the case, but they will look more precise and fine-grained when there are lots of values in a given range. – Ricky Robinson May 30 '13 at 08:58