Does anyone know how to draw a chart with pChart library where X and Y axis are crossed at [0; 0], or some custom point other than [x-min; y-min]?
I would like to create this chart:
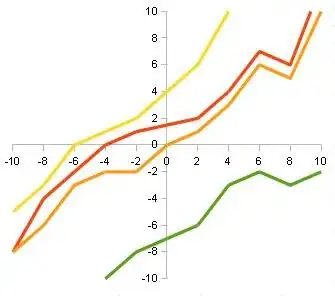
Does anyone know how to draw a chart with pChart library where X and Y axis are crossed at [0; 0], or some custom point other than [x-min; y-min]?
I would like to create this chart: