14

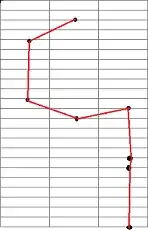
I'm struggling to put error bars into the correct place on a stacked bar. As I read on an earlier post I used ddply in order to stack the error bars. Then that changed the order of the stacking so I ordered the factor. Now it appears the error bars are correct on one set of bars but not the other. What I want is a graph that looks like that below, just with the standard error shown with error bars. I'm listing the dput of the original data and the ddply data as well as the data set.enter image description here

Suz2$org <- factor(Suz2$org, levels = c('fungi','bacteria'),ordered = TRUE)

library(plyr) 
plydat <- ddply(Suz2,.(org, group, time),transform,ybegin = copy - se,yend = copy + se) 

colvec <-c("blue", "orange")

ggplot(plydat, aes(time, copy)) + 
  geom_bar(aes(fill = factor(org)), stat="identity", width = 0.7) +
  scale_fill_manual(values = colvec) +
  facet_wrap(~group,nrow = 1)+
  geom_errorbar(aes(ymax=ybegin , ymin= yend ),width=.5) +
  theme(panel.background = element_rect(fill='white', colour='white'), 
        panel.grid = element_line(color = NA),
        panel.grid.minor = element_line(color = NA),
        panel.border = element_rect(fill = NA, color = "black"),
        axis.text.x  = element_text(size=10, colour="black", face = "bold"),  
        axis.title.x = element_text(vjust=0.1, face = "bold"),
        axis.text.y = element_text(size=12, colour="black"),
        axis.title.y = element_text(vjust=0.2, size = 12, face = "bold"))

plydat

plydat <- data.frame(
  org = ordered(rep(c("fungi", "bacteria"), each = 8L), levels = c("fungi", "bacteria")),
  time = factor(rep(rep(c("0W", "6W"), 2), each = 4L)),
  copy = c(
    97800000, 15500000, 40200000, 10400000, 55100000, 14300000, 1.6e+07, 8640000,
    2.98e+08, 77900000, 2.33e+08, 2.2e+08, 3.37e+08, 88400000, 3.24e+08, 1.89e+08
  ),
  group = factor(rep(c("Notill D0", "Notill D707", "Native D0", "Native D707"), 4)),
  se = c(
    11100000, 2810000, 7110000, 2910000, 1.7e+07, 1500000, 1930000, 2980000,
    43900000, 20100000, 56400000, 41200000, 75700000, 22500000, 57500000,
    28100000
  ),
  ybegin = c(
    86700000, 12690000, 33090000, 7490000, 38100000, 12800000, 14070000, 5660000,
    254100000, 57800000, 176600000, 178800000, 261300000, 65900000, 266500000,
    160900000
  ),
  yend = c(
    108900000, 18310000, 47310000, 13310000, 72100000, 15800000, 17930000,
    11620000, 341900000, 9.8e+07, 289400000, 261200000, 412700000, 110900000,
    381500000, 217100000
  )
)

Suz2

Suz2 <- data.frame(
  org = ordered(rep(c("fungi", "bacteria"), each = 8L), levels = c("fungi", "bacteria")),
  time = factor(rep(rep(c("0W", "6W"), 2), each = 4L)),
  copy = c(
    97800000, 15500000, 40200000, 10400000, 55100000, 14300000, 1.6e+07, 8640000,
    2.98e+08, 77900000, 2.33e+08, 2.2e+08, 3.37e+08, 88400000, 3.24e+08, 1.89e+08
  ),
  group = factor(rep(c("Notill D0", "Notill D707", "Native D0", "Native D707"), 4)),
  se = c(
    11100000, 2810000, 7110000, 2910000, 1.7e+07, 1500000, 1930000, 2980000,
    43900000, 20100000, 56400000, 41200000, 75700000, 22500000, 57500000,
    28100000
  )
)
    
Suz2

  org time     copy       group       se
1     fungi   0W 9.78e+07   Notill D0 11100000
2     fungi   0W 1.55e+07 Notill D707  2810000
3     fungi   0W 4.02e+07   Native D0  7110000
4     fungi   0W 1.04e+07 Native D707  2910000
5     fungi   6W 5.51e+07   Notill D0 17000000
6     fungi   6W 1.43e+07 Notill D707  1500000
7     fungi   6W 1.60e+07   Native D0  1930000
8     fungi   6W 8.64e+06 Native D707  2980000
9  bacteria   0W 2.98e+08   Notill D0 43900000
10 bacteria   0W 7.79e+07 Notill D707 20100000
11 bacteria   0W 2.33e+08   Native D0 56400000
12 bacteria   0W 2.20e+08 Native D707 41200000
13 bacteria   6W 3.37e+08   Notill D0 75700000
14 bacteria   6W 8.84e+07 Notill D707 22500000
15 bacteria   6W 3.24e+08   Native D0 57500000
16 bacteria   6W 1.89e+08 Native D707 28100000

moodymudskipper
  • 46,417
  • 11
  • 121
  • 167
user2055130
  • 396
  • 2
  • 12
  • 3
    +1 for detailed question, including a reproducible example. – Paul Hiemstra May 19 '13 at 07:43
  • 3
    While using barplot for data other than count is fundamentally wrong and for every barplot you draw (with error bars), a cute puppy and/or kitten dies, I am upvoting because of a well formed question and reproducible example. – Roman Luštrik May 19 '13 at 07:48

3 Answers3

14

The values for both ybegin and yend, the range of the errorbar, are too low for the bacteria data. Since the bars for bacteria are on top of the fungi bars, the height of the fungi bars (plydat$copy[plydat$org == "fungi"]) has to be added to the errorbar values of the bacteria data.

plydat[plydat$org == "bacteria", ] 
   <- transform(plydat[plydat$org == "bacteria", ],
                ybegin = ybegin + plydat[plydat$org == "fungi", "copy"], 
                yend = yend + plydat[plydat$org == "fungi", "copy"])

enter image description here

Sven Hohenstein
  • 80,497
  • 17
  • 145
  • 168
10

Personally, I'm not really fond of a stacked bar chart, especially when the number of stacked bars is large (which is not the case for you). The main problem is that fact that all but the lowest stack do not share the same baseline. In your case, it is hard to compare the orange bacteria class as they do not share the same base (y value, copy).

I propose to use a plot called a dotplot:

library(ggplot2)
theme_set(theme_bw())
ggplot(plydat, aes(time, copy, color = org)) + 
   geom_point() + facet_wrap(~group, ncol = 1) + 
   geom_errorbar(aes(ymax=ybegin , ymin= yend), width = 0) + coord_flip()

enter image description here

Note that the copy value is not additive here as it was in the stacked barchart. Because they share the same base copy value (0), you can easily compare between different values of bacteria. In addition, I swap the x and y axis to make it easy to compare the value of copy (just remove the coord_flip to see how bad that works in comparing copy).

The only real downside is that there is no easy way of judging the sum of fungi and bacteria. Depending on what the chart is meant to show (the story of the chart) this may or may not be a problem. You could add a separate additional category to org, i.e. both which is the sum of both categories, to remedy this. Of course, interpreting the error in this summed category is non-trivial.

Paul Hiemstra
  • 59,984
  • 12
  • 142
  • 149
4

From a combination of the above answers I think I'm going to go with something like this.

plydat <- ddply(Suz2,.(org),transform,ybegin = copy - se,yend = copy + se)   

colvec <-c("blue", "orange")

ggplot(plydat, aes(time, copy, color = factor(org))) + 
   geom_point(size = 3.5) + facet_wrap(~group, ncol = 4) + 
   scale_color_manual(values = colvec) +
   geom_errorbar(aes(ymax=ybegin , ymin= yend), width = 0.08, 
        color = "black", size = 0.1) +
   theme(panel.background = element_rect(fill='white', colour='white'), 
        panel.grid = element_line(color = NA),
        panel.grid.minor = element_line(color = NA),
        panel.border = element_rect(fill = NA, color = "black"),
        strip.background = element_blank(),
        axis.text.x  = element_text(size=10, colour="black", face = "bold"),  
        axis.title.x = element_text(vjust=0.1, face = "bold"),
        axis.text.y = element_text(size=12, colour="black"),
        axis.title.y = element_text(vjust=0.2, size = 12, face = "bold"))

enter image description here

user2055130
  • 396
  • 2
  • 12