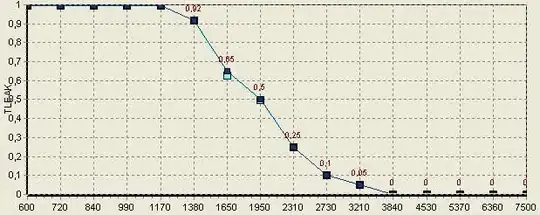
How does one get rid of white space when plotting in R as in the example below?

I would like to do this because when I want to multiple plots on a page it looks terrible.
I'm using the par function in the following way:
par(mfrow=c(5,3),mai=rep(0,4), omi=rep(0,4))
pie3D(c(4,2,2,3,6,3),main="example")
pie3D(c(4,2,2,3,6,3),main="example")
...
pie3D(c(4,2,2,3,6,3),main="example") #do this 15 times. In my real work, it's 15 different pie charts.
Which gives:

