I'm currently using the bfast package in R to decompose a time series. I was curious if it was possible to extract the slope of the trend segment before and after a breakpoint (until an end or another breakpoint)?
The example below was taken from the reference manual.
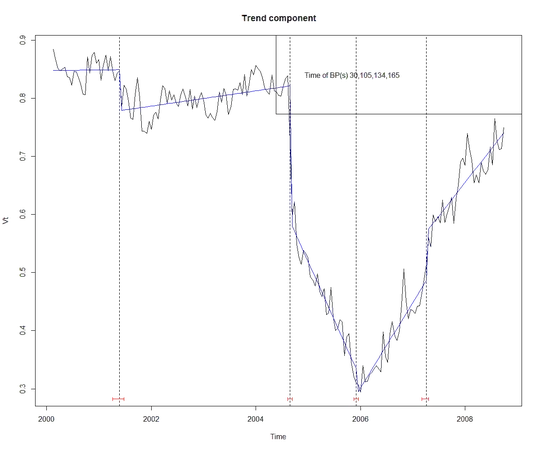
The code to generate this was here.
require(bfast)
require(strucchange)
require(sandwich)
require(forecast)
require(raster)
require(sp)
fit <- bfast(harvest, season="harmonic", max.iter=2)
plot(fit, type="trend")
The problem is that the result output objects aren't automatic, in other words, I can find the values between breakpoints and try to formulate the slope from those trend values, but the process is very time consuming because I have to manually find the start/end breakpoint values and extract every value in between. So ideally, I want to find an easier way to identify the slope of the trend (blue line) before and after all available breakpoints for multiple time series.
Any help is appreciated, thanks.