7

We want to use d3 to draw a network route graph that has fixed start and end node but different paths in between that might share some nodes, for example: enter image description here

I read comments from Configure fixed-layout static graph in d3.js and successfully created a simple graph like:

enter image description here

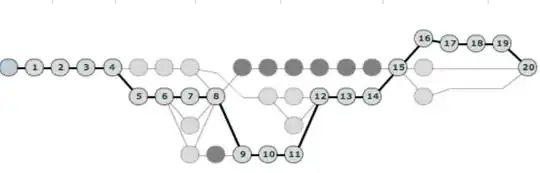
But as I add more nodes to the graph it becomes random (not static after refresh) and not orthogonal anymore:

enter image description here

So my questions are:

  • Is it possible to use d3.js to draw something close to the desired graph?
  • Or is there an algorithm out there I should employ in my graph implementation?
Community
  • 1
  • 1
frank
  • 262
  • 3
  • 9
  • It looks like you're initializing the force when you add new nodes. Is this using the force-directed layout? If so, then you need to remove any reference to force.start() or force.restart() to keep it from returning to a force-directed state. – Elijah May 08 '13 at 02:01
  • Yes: I am using force-directed layout. Did you mean to remove force-directed layout? How could I make sure the nodes do not collide without a repulsion force? – frank May 08 '13 at 16:35

3 Answers3

3

See my demo here。

http://jsfiddle.net/doraeimo/JEcdS/

The main idea is to make a connectivity based on a tree.

    //1)temporarily convert a connectivity to a tree        
    var tree = conv2tree(data);

    //2)calculate for nodes' coords with <code>cluster.nodes(tree);</code>
    var nodes = buildNodes(tree);

    //3)append all the edges(links) of the connectivity
    var links = buildLinks(data);
Anderson
  • 2,496
  • 1
  • 27
  • 41
  • The nodes systemD/E/F/G stack together though. Dagre solved our problem - it aligns the nodes very nicely. – frank Jul 12 '13 at 23:03
  • Nice! I think it's hard to do align for any complex network graph automatically. Is there some special algorithm? – Anderson Jul 15 '13 at 02:22
2

I built an example using Dagre-d3, which integrates Dagre (suggested by @frank) with D3.

// Display options
var options = {
  rankdir: "LR"
};

// Create the input graph
var g = new dagreD3.graphlib.Graph()
  .setGraph(options)
  .setDefaultEdgeLabel(function() {
    return {};
  });

// Set nodes
var n_nodes = 8;
for (var i = 0; i < n_nodes; i++) {
  g.setNode(i, {
    label: i
  });
}

g.nodes().forEach(function(v) {
  var node = g.node(v);
  node.shape = "circle";
});

// Set edges
g.setEdge(0, 1);
g.setEdge(1, 2);
g.setEdge(2, 3);
g.setEdge(3, 4);
g.setEdge(4, 5);
g.setEdge(1, 1);
g.setEdge(1, 6);
g.setEdge(6, 7);
g.setEdge(7, 0);
g.setEdge(7, 4);

// Create the renderer
var render = new dagreD3.render();

// Set up an SVG group so that we can translate the final graph.
var svg = d3.select("svg");

// Run the renderer. This is what draws the final graph.
render(svg, g);
.node {
  pointer-events: none;
}

.node circle {
  stroke: darkgray;
  fill: lightgray;
}

.edgePath path {
  stroke: black;
}
<script src="https://d3js.org/d3.v4.min.js" charset="utf-8"></script>
<script src="https://cdnjs.cloudflare.com/ajax/libs/dagre-d3/0.6.1/dagre-d3.min.js"></script>

<svg width=960 height=600></svg>
AlexM
  • 1,020
  • 2
  • 17
  • 35
1

Dagre solved our problem. It does exactly what we need.

frank
  • 262
  • 3
  • 9