I found a rather confusing feature in ggplot while trying to annotate segments on log10 scale. Following code produces the plot below:
library(ggplot2)
dat <- data.frame(x = x <- 1:1000, y = log(x))
ggplot(dat, aes(x = x, y = y)) +
geom_line(size = 2) + scale_x_log10() +
annotate("segment", x = 0, xend = log10(100), y = log(100), yend = log(100), linetype = 2) +
annotate("segment", x = log10(100), xend = log10(100), y = 0, yend = log(100), linetype = 2)
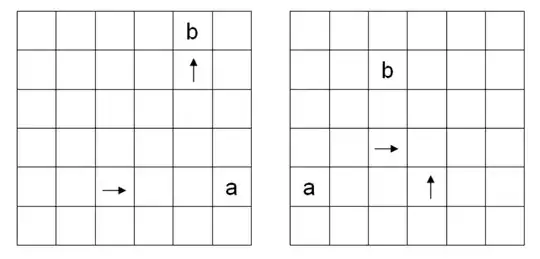
Whereas this is what I am after:
ggplot(dat, aes(x = x, y = y)) +
geom_line(size = 2) + scale_x_log10() +
annotate("segment", x = 0, xend = log10(100), y = log(100), yend = log(100), linetype = 2) +
annotate("segment", x = 100, xend = log10(100), y = 0, yend = log(100), linetype = 2)

In other words, I have to log10 transform the endpoint of the segment on x-axis, but not the beginning. Does this behaviour have a logical explanation? I understand that aes() does the transformations...but in this case, transformations on x-axis should be uniform (well, log10), right?
I am working on:
R version 3.0.0 (2013-04-03)
Platform: x86_64-w64-mingw32/x64 (64-bit)
ggplot2_0.9.3.1