Advice is needed with investigating performance issues at the website running on Asp.Net 4.0.
A little background on the website:
The website is a webshop built upon an e-Commerce framework, which has proven itself stable and reliable on many projects. Webshop has been working stable for quite some time (a year), but after customer upgraded their ERP (MS Dynamics NAV) to the later version performance issues started rising shortly.
The problem itself:
Application pool starts up normally, but consequently consumes nearly all available memory. So, apparently this is a mem-leak situation.
More concrete example: Last evening application pool was restarted, used memory was around 500 Megabytes. In about 16-18 hours the pool was running at around 2 Gigabytes already. The pool will keep growing further on, until nearly all memory is consumed and application becomes really slow.
Memory snapshots of the app-pool were taken with PerfView after pool restart and at 2 Gigs as well.
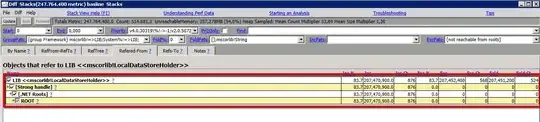
Diff of the snapshots is attached below:
As you can see, top line is mscrolib!LocalDataStoreHolder. If I try to open details about it, I can see the following Referred-From view as below:
 The problem is - i cannot open any of these nodes for deeper detail. So at the moment I cannot figure out, what's eating up the memory.
If it may be of any help, below is the RefTree screenshot. Here you can see that strong handles are taking up 92.2%.
So the question is - can anyone provide any hints or ideas on how to drill into deeper detail? How to find out, what's causing the mem-leak?
Thank you in advance
Edit:
I also tried the RedGate ANTS memory profiles, which is much adviced in various threads here.
Here's the summary picture after I took a few memory snapshots, with the latest one done after 20 hours and app-pool eating up around 3.7 Gb of RAM.
As you can see the huge red chunk on the left is "Unmanaged", 2.5 Gb in size. As ANTS says, this is either used up by CLR itself, or graphical data, or unmanaged data accessed through P/Invoke or COM+. Still, no idea how to get deeper details.