6

In my first steps, I'm using this not rational way, as described below:

  1. Create an HTML5 project to debug the JavaScript code.
  2. Create the definitive PHP project, with JS code already tested, where I debug the server side.

So I'm wondering if there is a smarter way of doing this?
E.g.: create a unique project and switch between native NetBeans JavaScript debugger and the (PHP) XDebug.

Sk8erPeter
  • 6,899
  • 9
  • 48
  • 67
ajmacedo
  • 91
  • 1
  • 8
  • 1
    Why aren't you debugging the JavaScript in the browser? – Matt Ball Apr 04 '13 at 02:25
  • 1
    Agree with @MattBall: you should be debugging JavaScript in the browser. You can use `Firebug` on *Firefox* or `Chrome Developer Tools` in *Google Chrome* – juan.obando Apr 04 '13 at 02:32
  • @MattBall, for laziness reasons... of coming back to NetBeans and edit the code, but it is the best way. Thanks for remember. – ajmacedo Apr 04 '13 at 03:26
  • @juanchopx2, I have already used Shift+Ctrl+I in Chrome, and it performs much better than NetBeans. Thanks! – ajmacedo Apr 04 '13 at 03:28
  • 1
    @MattBall: it can be more comfortable to debug AND modify (!) JavaScript code in NetBeans or another favourite IDE of yours. If you are used to write and debug codes in the IDE you configured to your taste (hotkeys, panels, etc.), why not using it? – Sk8erPeter Dec 28 '13 at 00:57
  • @Sk8erPeter because that's not where the code runs. I'm not saying it can't be done – Visual Studio can do it with IE, but it's brittle and requires close collaboration between the IDE and the browser (where the code is actually running, remember), and I don't think the added complexity there is worth it. – Matt Ball Dec 28 '13 at 01:12
  • 1
    @MattBall: it looks like you've never debugged JavaScript code with NetBeans - it's really simple and worth trying it. Here how to do it quickly: http://stackoverflow.com/a/20809988/517705. And the *"added complexity"* - which means only some minutes of reading+configuring - worth it. This way I can use the IDE I like for debugging and which I have configured, not the browser's inspector which can be a bit more uncomfortable than the IDE for such tasks. By the way, I admit that the browsers' tools are very smart, I also like and do use them, but like the IDE more for debugging purposes. – Sk8erPeter Dec 28 '13 at 01:26

1 Answers1

5

For JavaScript debugging in Chrome, you should use the official NetBeans Connector extension.

Here's an example on how to debug JavaScript code with NetBeans + Chrome + NetBeans Connector:

Debugging and Testing JavaScript in an HTML5 Application https://netbeans.org/kb/docs/webclient/html5-js-support.html

After creating a new project, you should "Confirm that Chrome with NetBeans Connector is selected in the dropdown list in the toolbar":

Confirm that Chrome with NetBeans Connector is selected in the dropdown list in the toolbar

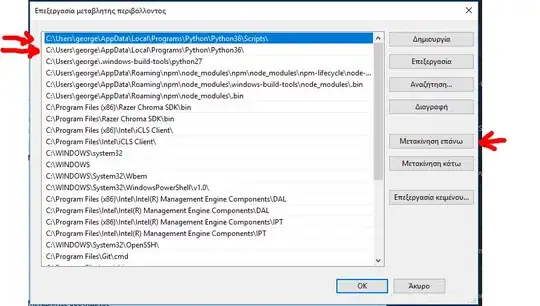
(it looks like this in my NetBeans:
NetBeans Connector)

Put some breakpoints before some lines:

JS code breakpoints

and hit Run. After hitting Run, you will see a yellow warning bar which looks somehow like this, stating ""NetBeans Connector" is debugging this tab":

"NetBeans Connector" is debugging this tab

Do NOT open Chrome's built-in web inspector toolbar now (or you'll get a warning that this breaks the regular debugging process in NetBeans).

Now you can debug JavaScript code in NetBeans, the code will run in Chrome. You should open Window → Debugging → Variables panel to inspect the variables.

Or mouse over some items:

NetBeans JS code debugging; variable


Regarding debugging PHP code, here are some relevant official articles:

Sk8erPeter
  • 6,899
  • 9
  • 48
  • 67