I can't seem to be able to debug. When I try to, I don't get any build errors, and the layout changes to debug mode, but the windows never pops up. I have an orange bar at the bottom of VS, which I think is standard, but nothing happens after that. It's not just in the project I'm working on. I have started a new WFA and tried to debug without adding any code and the same thing happens. Anybody have similar issues?
Asked
Active
Viewed 4.5k times
9
-
Are you sure that you are putting your breakpoints? – Jean Mar 31 '13 at 00:38
-
1What does the Output panel say in the Debug mode? – Rob G Mar 31 '13 at 00:38
-
Why is this question *"migrated from programmers.stackexchange.com"* ? – I4V Mar 31 '13 at 00:41
-
Debugging issues are sometimes quite different depending on the UI technology. Are you using Winforms? ASP.NET? I suggest you provide this information in your question and tag it accordingly. – Tim Mar 31 '13 at 00:41
-
Are you compiling in Debug mode (as opposed to release mode)? – Steve Wellens Mar 31 '13 at 00:48
-
1@I4V: Because it was originally posted at Programmers, closed there as being off topic, and moved here where it is more appropriate. – Ken White Mar 31 '13 at 00:55
-
try forcing your project to compile in x86 mode.. If that works, refer to this question. http://stackoverflow.com/questions/11179030/cant-start-debugger-in-vs2012-rc I know it's about 2012 RC, but it could be the same issue. Hope it helps. – Madushan Mar 31 '13 at 01:11
-
VS has been started in admin mode? – Thomas Mar 31 '13 at 11:20
12 Answers
15
I've encountered this before. Not sure what causes it, but generally it is one of a couple of things to fix it.
- make sure you are building in debug and not release
- close VS, go to the project's dir and delete the obj and bin directories. Reopen in VS and rebuild.
- there is an option under tools - options - build (iirc) that allows for checking if source is same as code file. However, you should see a message in output window if this is the case.
- on the project properties in the build (iirc) you can throttle the pdb file from full debug symbols to no pdb at all. If you are not the only person on the project check this setting still has full pdb enabled (low probability this got changed though)
- make sure you're on the right platform that you are building to (x64 vs x32)
...lots more, but a starting place...
Addendum as per comment...
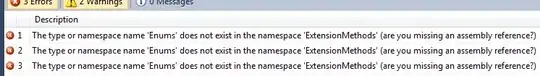
So, those messages are good. It is saying there are no problems (but it sounds like you already know that :) ). I would start with the general debug options you mention. Do this on a hello world app. That way you can troubleshoot the lowest common first. Here are my settings. Try to match them and see if that works. For example, I know "ask before deleting breakpoint" is irrelevant, but "break all processes when one process breaks" is important. So, I just added them all to make it easier to troubleshoot.
ALso, make sure you are getting a red dot here like so in your code in visual studio (I've seen instances where VS won't let you put this here):

-
-
OK. Here is what the output window says: The thread 'vshost.LoadReference' (0x1e58) has exited with code 0 (0x0). 'CrochetAuLait2.vshost.exe' (Managed (v4.0.30319)): Loaded 'C:\Users\Admin\documents\visual studio 2012\Projects\CrochetAuLait2\CrochetAuLait2\bin\Debug\CrochetAuLait2.exe', Symbols loaded. I tried deleting the obj and bin directories, but the same issue arose. I am in debug, and on the same x32 laptop that I wrote it on. Also, this morning I wrote a hello world console app, and it had the same problem. That's why I think it must be some universal setting in VS. – will Apr 03 '13 at 15:30
-
1
- Right click on the project
- Click on the properties.
- go to web.
- Check the Box for Enable Edit and Continue .
Hope that helps :)
user3082600
- 11
- 1
0
This is an issue with visual studio 2012. It doesn't ALWAYS show up. I've found that if you stop your program during debugging, or if you close the console window, this will almost always trigger.
However, letting it run to completion isn't enough either, sometimes this just happens.
Also you can build your application in debug mode, go to the output, run the program, and attach to that process. :P
Alex
- 1
0
Amazing answers already given but they dont help in the purpose. So here is my finding, no matter if i am late in answering, but it really works for me.
Even if you are developing a web app, just go to the website properties by right-clicking the project and then you see a "Web" tab on left as i have highlighted. Then just check the box saying "Enable Edit and Continue". Thats all you need to do. it works for me!

KMX
- 2,631
- 1
- 23
- 28
0
I had a similar problem, and solution was absolutely dumb. VS was confused with two instances of Internet Explorer in “Browse with” setting. So, I set Google Chrome (any browser) as default, and then set IE as default again. It deleted the other instance of IE (only one remained) and debugging was enabled. Hope it help!
0
I had a similar issue.
I added up:
using namespace std;
and this solved the problem
user2286810
- 136
- 9
0
For me, uninstalling the Redgate's Reflector plugin that had expired fixed it. I spent more than 4 hours uninstalling, rebooting, reverting to older code, etc etc..
Mukus
- 4,870
- 2
- 43
- 56
0
When my default browser was changed to CHROME, I could no longer debug my User Interface. Setting IE back to the default browser fixed it. Alternatively you can attach the process plug-in during debug.
Hunter Kingsley
- 51
- 1
0
I had the same problem with my desktop application and as this forum says you should mark your project as a startup project, since visual studio has unmarked. It worked just fine for me an I believe it will help other people that may have this problem, since I believe you have finished this project.
g_brahimaj
- 197
- 7
- 21
0
One of my VB .NET Winforms projects wouldn't allow debugging. This was due to the configuration manager set to 'Release' even though the toolbar dropdown indicated 'Debug'.
You need to select the mode dropdown and select the last option 'Configuration Manager' and ensure that the main project is set to 'Debug' and not 'Release'
John M
- 14,338
- 29
- 91
- 143
0
Install Microsoft SSDTSetup.exe 450Kb and Close the SSDT tool during install. After installation open the SSDT tool and execute the script task and Component with breakpoint. Worked for me
Kaushik
- 1