0

I don't get why my App crashes on real device when using Instruments. Without Instruments attached to the APP process it doesn't. What are the most common causes for this?

EDIT: I changed the Schema to Release in the "Profile" schema (it was set to build). This allowed the game to reach the second scene. However the problem persist as it crashes after few seconds. Looking at the "Allocations" graph the maximum peak value is 18/20MB, doesn't seem so high. There are no other programs running on the iPod touch 4 gen I am using.

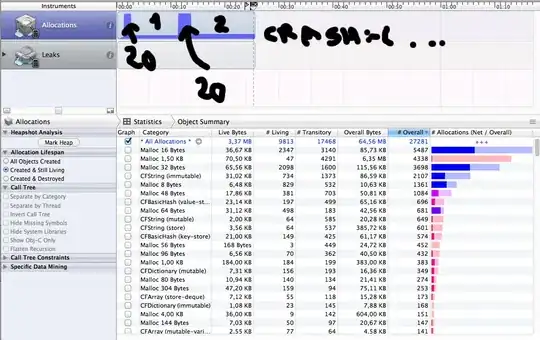
In the photo below scene 1 is marked with 1, and the second with 2.

What happens

EDIT 2: My Instruments seems to be using 60MB of real memory usage (as happens to this user):

enter image description here

Community
  • 1
  • 1
mm24
  • 9,280
  • 12
  • 75
  • 170
  • no crash reason shown in instruments ? – Shubhank Mar 30 '13 at 16:47
  • 1
    one reason: Instruments adds to the app's memory usage. Try running Instruments in "low memory" mode. – CodeSmile Mar 30 '13 at 16:53
  • @LearnCocos2D It seems that my Instruments is using about 60 MB of real memory usage vs the 23 MB of my Game. I am looking for ways to reduce this (I am playing with the size of the D-Trace depth). – mm24 Mar 30 '13 at 20:45
  • 1
    put instruments in memory constraint mode (check all menus, it's there just can't remember exact name). – CodeSmile Mar 31 '13 at 00:22
  • @LearnCocos2D thank u. I tried to look for it but wasn't able. Is 3 am so I am probably to xxxx up to find it. I tried googling and looking on the Developer library and didn't find much. I attach a screenshot of the area in "Instruments->Preferenes" where I also looked at, finding "only" ways to reduce the DTrace and Background profiling rate. I guess changing this is the only way to reduce the memory that I can find. As said before I tried that but doesn't change much. – mm24 Mar 31 '13 at 01:13

0 Answers0