0

I have a website with a simple page. On click of a button we execute a MDX query which returns around 200,000 rows with 20 columns. I use following code to execute MDX query using Microsoft.AnalysisServices.AdomdClient library (version is 10.0.0.0 runtime version v2.0.50727)

        var connection = new AdomdConnection(connectionString);
        var command = new AdomdCommand(query, connection)
        {
            CommandTimeout =  900
        };

       connection.ShowHiddenObjects = true;
       connection.Open();
       var cellSet = command.ExecuteCellSet();
       connection.Close();

While the query is executing the memory usgae of the app pool goes very high.

This is the initial state of the memory usage on the server : Initial State

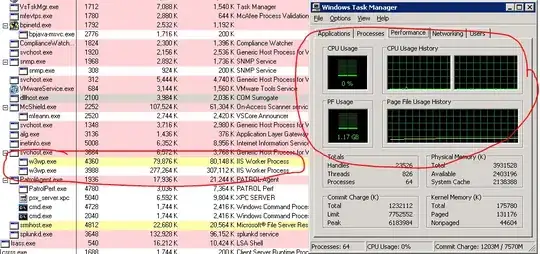
After running the query: enter image description here

I am not sure why the memory usage goes so high and stays like that. I have used profiler on my local box and everything looked ok.

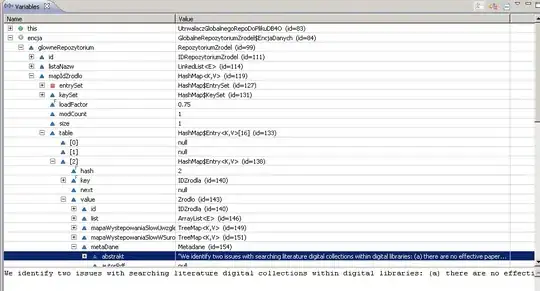
What options I have to figure out what is holding on to the memory?

Is there any explicit way to clear off this memory?

Does ADOMD library always consumes this much memory? Do we have any alternate options to execute MDX queries using C#?

When the memory usgae goes this high, IIS stop processing other queries and the application hosted on same IIS server (using different app pool) also get affected and request takes longer to execute.

SharpCoder
  • 18,279
  • 43
  • 153
  • 249

1 Answers1

0

I've recently started at a place where we have a similar issue.

Your options to figure out whats holding memory are:

  1. Download a memory profiler such as Redgate's Ants profiler, and that will allow you to see whats going on in the App pool. However theres only a 2 week trial but will allow you to see whats going on initially.

  2. Get hold of CLR Profiler, this tool can be downloaded and allows you to see snapshots of the memory, so you can tell whats in memory in the CLR.

One thing to be aware of is the Large Object Heap, by design the CLR will not compact space in the LOH and so if objects are put there then that can lead to memory fragmentation. Objects greater than 85000 bytes get put there. One example is large lists of objects.

One thing I've tried doing to get around it is create a specialised collection like a composite list, which basically is a list of lists, then as each component list is under 85000 bytes it will remain in the normal heap and the entire object misses being put into the LOH. Others too have mentioned this approach.

That said I'm still having issues, as the composite list hasn't really sorted out the problem so there are still other factors at play which need to resolve. Am puzzled at it and thinking that a memory dump of the app pool and analysing with winDbg may provide further answers.

One further point, although I'm sure its not the source of the problem, is that its recommended to have a using statement for your connection, as otherwise if there's an exception before your close statement then it may not get closed.

Mickey Puri
  • 835
  • 9
  • 18