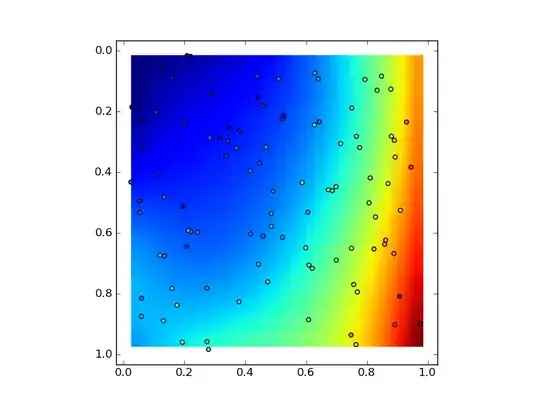
I have got the 10,000 values for my data using Matlab. When I plotted the histogram and fitted it with normal distribution I got the following figure 
Is there some mistake in this histogram fitting or what should I do to scale it properly.
I have got the 10,000 values for my data using Matlab. When I plotted the histogram and fitted it with normal distribution I got the following figure 
Is there some mistake in this histogram fitting or what should I do to scale it properly.