This question relates to another ongoing question here: Format Stones and Pounds correctly?
I figured it would be more suitable to ask here as a separate question, before deciding what to do.
As described from the link above, I am representing weight in a TChart as stones and pounds.
Before I decide on whether to change the data type I am currently using (Double) as the comments from above suggest, I want to see how I can display my chart in Stones and Pounds as I originally had in mind.
See this sample image I manipulated for demo purposes:
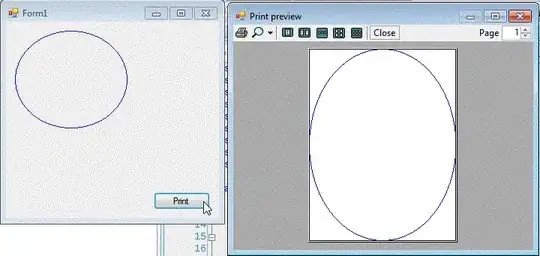
The problem is the left Axis of the chart, as the notes in the image state - the chart increments up to .99 (Pounds) before reaching the next whole number (Stones in this case). For example:
- 03.00
- 02.99 < .99 = max number before reaching 3.00
- 02.98
- 02.97
I need the Left axis to be setup like so:
- 03.00
- 02.13 < .13 = max number before reaching 3.00
- 02.12
- 02.11
- 02.10
And also display all the labels for the pounds part.
Is there a setting somewhere that I can use to set the max value for the .00 (lbs) before reaching the next whole number (stones)?
At the moment nothing seems to be making a lot of sense, From what I understand from the other question is I should be using Integers and representing as Pounds only.
I want to see how it could look before making any changes though, ideally I want the chart to stay near the same as the image if possible.
Hope this makes sense.
Thanks.
UPDATE
Just thought I would update the changes I eventually got working.
All credit has to go to David Heffernan for his persistence in explaining where I was going wrong, and writing detailed information and advice.
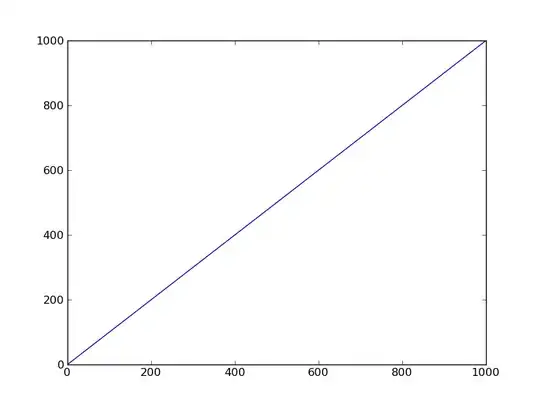
There is still some work I need to do, but for now here is the updated chart I now have:

I have not done the values in labels, but from the sample image above this is the values I used:
- 15.2
- 15.3
- 15.11
- 15.13
- 16.0
- 16.4