-2

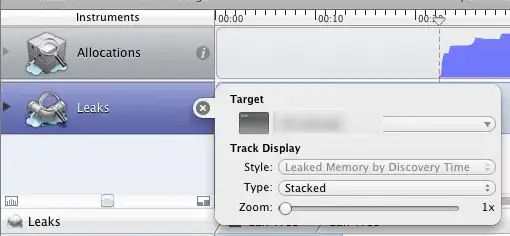
I am running instruments to analyze memory leaks in my application,

but it does not show any responsible libraries for any allocations: enter image description here

Neither it shows any methods/variables in stack trace, it just shows this: enter image description here

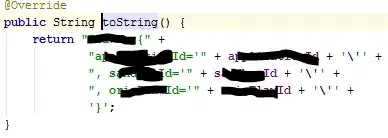
Is there any setting that I am missing? It used to show earlier, it has stopped showing these just recently.

Nikita P
  • 4,226
  • 5
  • 31
  • 55
  • Is this problem persistent? Have you tried closing Instruments and repeating your profiling? Sometimes this happens to me temporarily, I think Instruments experiences an internal issue that prevents it from loading the necessary information to load and display everything appropriately. – Elliott Mar 15 '13 at 10:42
  • Also confirm that your build settings are not stripping debug symbols (by default your release build will do that and it is desired behavior for your final product). I always make sure I am using my development profile when using instruments. – borrrden Mar 15 '13 at 10:43
  • @ElliottPerry Its persistent. It is coming Every time even after restarting Xcode/instruments. Although I din't try restarting the mac. – Nikita P Mar 15 '13 at 10:45
  • @borrrden: I am also using my development profile. – Nikita P Mar 15 '13 at 10:46
  • @borrrden now its only doing with device..responsible libraries are being shown with simulator – Nikita P Mar 22 '13 at 10:19

2 Answers2

1

Here are a couple screen shots of how I currently have mine configured. Maybe these will help. First thing I would do is check to make sure that within the current scheme, you have your "Profile" Build Configuration set to Debug like in the first image below.

Also, have you tried right clicking on "Responsible Library" header to remove the checkmark and re-add it like in my last screenshot, to give it a virtual smack? I'll keep looking to see if I can find out anything else more helpful.

enter image description here

Screenshot 1

enter image description here

enter image description here

codeqi
  • 753
  • 1
  • 6
  • 14
-1

Close instruments. Make sure spotlight indexes your build artifacts. You can do this manually by running mdimport from the command line. Reopen instruments.

Obviously, make sure your derived data location, etc. is not in spotlight's blacklist. This is controlled by System Preferences.

Instruments relies on Spotlight for a lot of what it does.

quellish
  • 21,123
  • 4
  • 76
  • 83