3

I want to know how to access JavaScript execution trace at runtime. I saw Firebug can do something like this:

enter image description here

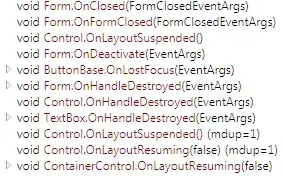
Refer to the image above, all the line numbers executed are highlighted in green. They are achieved at runtime. I guess there must be some way to access those info from the JavaScript engine used by the browser.

Say now I want to build a firebug plugin to access those info and examine all the variables in each executed line at the runtime, how should I start?

Fshly
  • 121
  • 7
  • This is not the case in the firebug. It shows green lines only on the lines which has some execution in it (hence excluding braces `{}`). The lines may not get executed. It doesn't show execution trace. Try putting `if(){} else{}` into the code and see it will show both blocks on code with green lines – nefarianblack Mar 15 '13 at 07:52
  • @tanmaykhandelwal Thanks, but it is not true. Please refer to my updated screenshot. Thank you. – Fshly Mar 15 '13 at 08:08
  • Which version of firebug do you have. I have 1.11.2 which also shows green line number at the line `if(false){`. Can you add an executable line in the false condition of if statement as well? Like this: `if(false){var a = '1';} else {var b = '2';}` – nefarianblack Mar 19 '13 at 09:12

1 Answers1

1

Obviously you asked the same question in the Firebug forum.

To duplicate Honza's answer:

Firebug is currently using JSD (jsdIDebuggerService) to figure out, which line is executable. However, the plan is to switch to JSD2 (work in progress) https://wiki.mozilla.org/Debugger

You should also base your extension on JSD2

Look for getLineOffsets(line) and getOffsetLine(offset) in the Debugger document. I didn't test it, but I think that if getLineOffset returns null, the line is not executable.

Sebastian

Sebastian Zartner
  • 18,808
  • 10
  • 90
  • 132