0

The labels I use on axis for my graph contains text with more than one word. Like this:

enter image description here

and it looks bad. I tried (as you can see on the graph) to replace the wit spaces with brs or with \n in order to render the text in multiple lines. The result is not what I was expected to get.

How to split the ticks text into words and to draw each word on a row?

Zelter Ady
  • 6,266
  • 12
  • 48
  • 75

2 Answers2

2

The <br/> is working will trying to split your text into two lines. See a working example here.

In order to make it work, don't forget to load some jqplot plugins : CanvasAxisTickRenderer, CategoryAxisRenderer. You then need to apply tickRenderer: $.jqplot.CanvasAxisTickRenderer to your serie(s). You need as weel to apply renderer: $.jqplot.CategoryAxisRenderer onto your yaxis.

AnthonyLeGovic
  • 2,335
  • 1
  • 13
  • 22
  • Thanks for your example. I see it working. But in my code - I build dynamically the series and ticks I cannot make it work. In my case, as you can see, the
    or space if I use "\n" is rendered instead of new line. I don't know what do I mist!
    – Zelter Ady Mar 17 '13 at 09:45
  • Can you check if "
    " tag and "\n" are escaped? CanvasAxisTickRenderer plugin is well loaded and used in your serie(s)?
    – AnthonyLeGovic Mar 18 '13 at 07:36
  • All the issues are because of the framework I use on client side to manage page's elements. I run your example on the same place where the other graphs are rendered and your graph renders correctly - with words split on rows - and the other no. How do I check, at runtime, using firebug, if
    is escaped?
    – Zelter Ady Mar 18 '13 at 07:45
  • witch property should I check to see the text? – Zelter Ady Mar 18 '13 at 09:10
  • You can use console.log(#myticks#) in your code. It will appear in the firebug console. Where #myticks# is the variable containing your ticks – AnthonyLeGovic Mar 18 '13 at 09:17
0

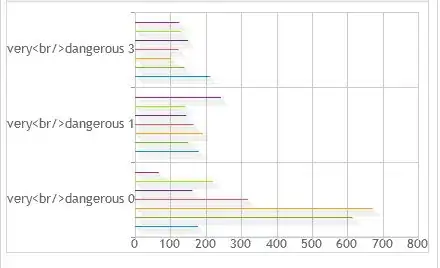
For me, <br/> didn't work and \n did.

My configuration:

jQuery.jqplot(element, configuration.series, {
        stackSeries: true,
        animate: false,
        captureRightClick: false,
        seriesColors: ['green', 'blue', 'yellow', 'orange', 'red'],
        seriesDefaults: {
            renderer: jQuery.jqplot.BarRenderer,
            rendererOptions: {
                shadowOffset: 0,
                barDirection: 'horizontal',
                highlightMouseDown: false,
                barWidth: 20,
            },
            pointLabels: {
                show: false
            }
        },
        axesDefaults: {
            min: 0,
            minorTicks: 0,
            tickOptions: {
                formatString: '%d'
            }
        },
        highlighter: {
            show: false
        },
        axes: {
            yaxis: {
                renderer: jQuery.jqplot.CategoryAxisRenderer,
                ticks: configuration.labels
            },
            xaxis: {
                ticks: configuration.ticks,
                label:'Hours',
                labelOptions:{
                    fontFamily:'Helvetica',
                    fontSize: '10pt'
                },
            }
        }
    });
sveilleux2
  • 1,442
  • 12
  • 16