0

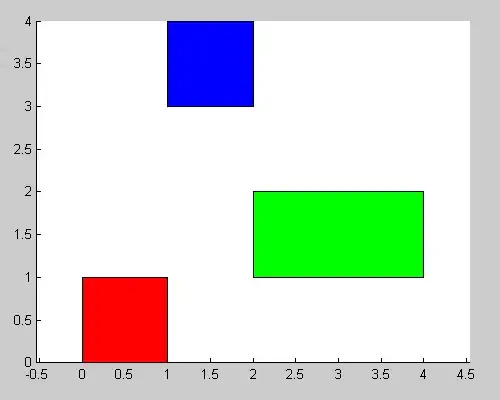
I need help to draq a graph with jqplot. The graph is simple, but jqplot make it complicated. I need to get a graph like this:

enter image description here .

with some improvements:

The colors are defined here:

graphColors = ['#048ff1', '#79b924', '#ffa600', '#ef5257', '#7b279b', '#8ff104',
               '#b92479', '#5257ef', '#279b7b', '#f1048f', '#00ffa6', '#9b7b27']

Some render options are here:

seriesDefaults: {
    seriesColors: graphColors,
    renderer: $.jqplot.BarRenderer,
    rendererOptions: { barDirection: 'vertical' }
    },
    axes: {
        yaxis: {
            renderer: $.jqplot.CategoryAxisRenderer,
            ticks: [ /* to be filled in automatically */ ]
        },
    xaxis: {
        min: 0
        }
    }

and the data I need to render is here:

//in the image I used instead of letters '1'
data = [[['a', 1112]],
        [['b', 1127]],
        [['c', 822]],
        [['d', 1039]]
       ];

Questions:

  1. How to set for each bar a label ('a', 'b', 'c', 'd' etc)?

  2. How to move the series to start from left (and not in the middle as now, of course with a small margin on left?

  3. The values on y axis, values bigger than 1000 are rendered over the graph lines. How to set a space between axis values and graph?

  4. The graph I want to draw is simple. It is possible to obtain the same result without using series? All I want is a bar graph with each bar having a distinct color and displaying a specific label?

Thank you.

Zelter Ady
  • 6,266
  • 12
  • 48
  • 75
  • 1
    It amuses me that you say it's such a simple graph, but then have a list of very specific tweaking you need. On number 2 above, if the graph is not centered, do you want lots of empty white space to the right? – Mark Mar 12 '13 at 15:37
  • Should be simple. I cannot imagine a simpler graph than a bar graph where each bar is a pair [label, value]. – Zelter Ady Mar 12 '13 at 15:41
  • I need all the graph aligned left. The numbers of the bars may vary. Between 2 bars I need to define the distance (let's say 30px for now). Also should be a left padding - a distance between first bar and the yaxis. – Zelter Ady Mar 12 '13 at 15:43

1 Answers1

1

See code and comments below. Fiddle here.

Item 2 on your list, I'm unclear about, if you push the plot to the left, you have empty white space on the right. It's better to let the plot fill all the available space.

$(document).ready(function(){

   var graphColors = ['#048ff1', '#79b924', '#ffa600', '#ef5257', '#7b279b', '#8ff104',
           '#b92479', '#5257ef', '#279b7b', '#f1048f', '#00ffa6', '#9b7b27'];

   var data = [
        [1112],
        [1127],    
        [822],
        [1039]];

    var ticks = ['This is how to tick'];

    plot2 = $.jqplot('chart1', data, {
        seriesColors: graphColors, 
        seriesDefaults: {                
            renderer:$.jqplot.BarRenderer
        },
        axesDefaults:{pad: 1.3}, // Item 2, increase this padding so labels are cut off
        // Item 4, no, jqplot treats each differently colored bar as a series, so you must provide series options
        series:[
            {pointLabels:{show:true,labels:['a']}}, // Item 1, the label for each bar is the "labels" array 
            {pointLabels:{show:true,labels:['b']}},
            {pointLabels:{show:true,labels:['c']}},
            {pointLabels:{show:true,labels:['d']}}
        ],
        axes: {                
            xaxis: {
                renderer: $.jqplot.CategoryAxisRenderer,
                ticks: ticks // comment this out for "autoticks"
            }
        }
    });
});

enter image description here

Mark
  • 106,305
  • 20
  • 172
  • 230
  • Thanks mark for your answer. Regarding the 2nd question: I need to align the graph to the left, even if this means a lot of free space in the right. Each bar should have a fixed size (width) and between 2 bars should be a fixed distance. The left space remains empty. – Zelter Ady Mar 12 '13 at 15:46
  • Do you know how to dynamically set the pointLabels values, from an array of strings? I build that part inside a separate function and I pass it to the $.jqplot function as parameter. I have a separate function that builds for me the jqplot options using some parameters. – Zelter Ady Mar 12 '13 at 16:01
  • 1
    Something like `series = $.map(['a','b','c','d'], function(i){return({pointLabels:{show:true,labels:[i]}})})`? – Mark Mar 12 '13 at 17:15