4

I have 3D matrix of floating point numbers and I would like to produce a smoothed 3D surface of this matrix using R. Any suggestions are welcome. Thanks

Now I am using scatterplot3d ... But this function did not produce a smoothed surface

x<-read.table("/Users/me/Desktop/data.txt")
scatterplot3d(x$V1, x$V2, x$V3, highlight.3d = TRUE, angle = 30, col.axis = "blue", col.grid = "lightblue", cex.axis = 1.3, cex.lab = 1.1, pch = 20)
JasonMArcher
  • 14,195
  • 22
  • 56
  • 52
  • 1
    Outputting a portion of your data will greatly increase your chances of getting help. You can simply paste the output of `dput(head(x))` into your question above. Thanks – Simon O'Hanlon Mar 07 '13 at 16:18
  • > dput(head(x)) structure(list(V1 = c(0.01, 0.013971025, 0.019832054, 0.021035526, 0.023956488, 0.027962379), V2 = c(0.01, 0.011738323, 0.011925891, 0.011990806, 0.013416452, 0.014304923), V3 = c(8.21e-19, 3.47e-17, 1.77e-15, 3.64e-15, 1.39e-14, 5.46e-14)), .Names = c("V1", "V2", "V3"), row.names = c(NA, 6L), class = "data.frame") – Mohamed Bouguessa Mar 07 '13 at 16:28
  • Put the dput dump in the question! The idea here is improved improved questions and answers. – mdsumner Mar 07 '13 at 19:40

3 Answers3

2

If you are able to create a 2D matrix (x,y) with the value being the z-axis value you could use the following

persp

Here is an example from R Graph Gallery. persp example

larrydag
  • 1,183
  • 1
  • 8
  • 4
2
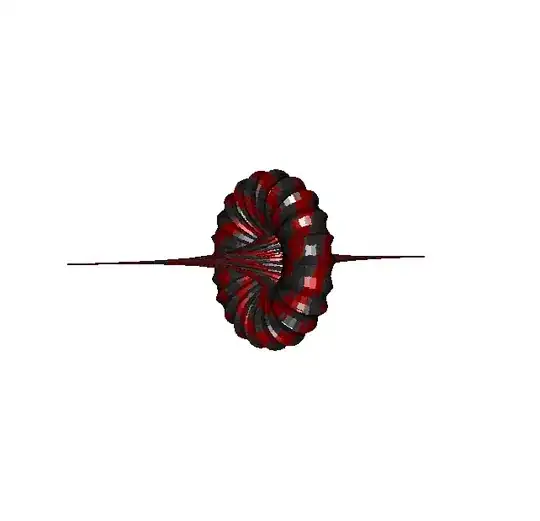
require(misc3d)

a <- 2/5

wsqr <-  1 - a^2
w <- sqrt(wsqr)
denom <- function(a,w,u,v) a*((w*cosh(a*u))^2 + (a*sin(w*v))^2)

fx <- function(u,v) -u + (2*wsqr*cosh(a*u)*sinh(a*u)/denom(a,w,u,v))
fy <- function(u,v) 2*w*cosh(a*u)*(-(w*cos(v)*cos(w*v)) - (sin(v)*sin(w*v)))/denom(a,w,u,v)
fz = function(u,v) 2*w*cosh(a*u)*(-(w*sin(v)*cos(w*v)) + (cos(v)*sin(w*v)))/denom(a,w,u,v)


parametric3d(fx = fx, fy = fy, fz = fz, 
             umin = -17, 
             umax = 17, 
             vmin = -77, 
             vmax = 77, 
             n = 100,
             color = c("grey17","grey21","red4","darkred","red4","grey21","grey17"),
             engine = "rgl")

enter image description here

N8TRO
  • 3,348
  • 3
  • 22
  • 40
2

I think that mba.surf from the MBA package would be a good choice for the smoothing, and as larrydag above suggests, persp would be good to image it. The code below is from the help page for the mba.surf function (swap LIDAR for your 3 column dataframe):

data(LIDAR)
mba.int <- mba.surf(LIDAR, 300, 300, extend=TRUE)$xyz.est
# Two ways of imaging....
image(mba.int, xaxs="r", yaxs="r")
persp(mba.int, theta = 135, phi = 30, col = "green3", scale = FALSE,
  ltheta = -120, shade = 0.75, expand = 10, border = NA, box = FALSE)

enter image description here

Simon O'Hanlon
  • 58,647
  • 14
  • 142
  • 184