Background
I have a primefaces line chart (date on x, integer >= 0 on y) extended with jqplot options:
function extender() {
        this.cfg.axes = {
            xaxis : {
                renderer : $.jqplot.DateAxisRenderer,
                rendererOptions : {
                    tickRenderer:$.jqplot.CanvasAxisTickRenderer
                },
                tickOptions : {
                    fontSize:'10pt',
                    fontFamily:'Tahoma',
                    angle:-40,
                    formatString:'%b-%y'
                },
                tickInterval:'2592000000'
            },
            yaxis : {
                min: 0,
                rendererOptions : {
                    tickRenderer:$.jqplot.CanvasAxisTickRenderer,
                },
                tickOptions: {
                    fontSize:'10pt',
                    fontFamily:'Tahoma',
                    angle:0,
                    formatString: '%d'
                }
            },
        };
        this.cfg.axes.xaxis.ticks = this.cfg.categories;
    }
I'm using the jqplot extender to have custom date interval on the x-axis and this is working fine:

Problem
When I use the option min: 0 in the y-axis the formatting of numbers goes really funky, especially when there are small values:
Note that the minY attribute in primefaces doesn't work (probably because the extender overwrites it)
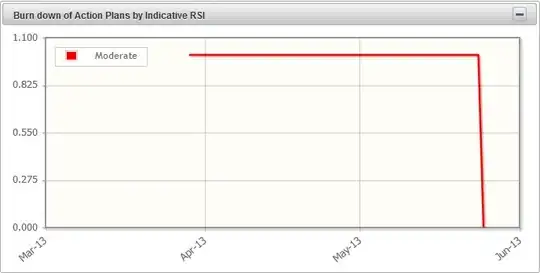
To fix that, I use formatString: %d. It works but it creates problem with the number of ticks:

As you see on the screenshot, there are several times the line for the value 1.
Question
How can make sure I don't get several times the same value on the y-axis?
I can't really have a static number of ticks because when the data grows large (let's say around 100), I do want several values on the y-axis (e.g 20, 40, etc...)