0

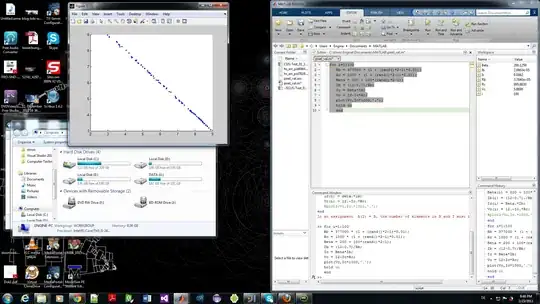
How get this 'for loop' to plot 100 values in matlab? Can't figure out where to include the 'i'
This is a monte carlo analysis plot of the operating point of a common-emitter amplifier

for i=1:100
   Rb = 377000 * (1 + (rand()*2-1)*0.01);
   Rc = 1000 * (1 + (rand()*2-1)*0.01);
   Beta = 200 + 100*(rand()*2-1);
   Ib = (12-0.7)/Rb;
   Ic = Beta*Ib;
   Vc = 12-Ic*Rc;
   plot(Vc,Ic*1000,'.');
   end
vcsjones
  • 138,677
  • 31
  • 291
  • 286
Andre Marin
  • 540
  • 1
  • 6
  • 16

1 Answers1

0

enter image description herewhat about this ? add hold on you got than you 100 points ??

 figure;
 axes('NextPlot',add'); %This remove the need to call hold on, also  I added an extra ' for SO formatting
 for i=1:100
    Rb = 377000 * (1 + (rand()*2-1)*0.01);
    Rc = 1000 * (1 + (rand()*2-1)*0.01);
    Beta = 200 + 100*(rand()*2-1);
    Ib = (12-0.7)/Rb;
    Ic = Beta*Ib;
    Vc = 12-Ic*Rc;
    plot(Vc,Ic*1000,'.');
  end
slayton
  • 20,123
  • 10
  • 60
  • 89
Engine
  • 5,360
  • 18
  • 84
  • 162
  • they are supposed to have very similar syntax, ........actually tying in 'hold on' made it work thanks! not sure what that does. i'll investigate! – Andre Marin Feb 23 '13 at 20:56
  • @slayton why ? what 's the difference ?? – Engine Feb 25 '13 at 09:10
  • 1
    @Engine, its mainly a stylistic difference but it helps educate people about how to create objects exactly how you want them rather than creating them and modifying them in 2 calls – slayton Feb 25 '13 at 13:40