32

I have run a random forest for my data and got the output in the form of a matrix. What are the rules it applied to classify?

P.S. I want a profile of the customer as output, e.g. Person from New York, works in the technology industry, etc.

How can I interpret the results from a random forest?

Nick Stauner
  • 395
  • 3
  • 13
user2061730
  • 329
  • 1
  • 3
  • 3

4 Answers4

40

The "inTrees" R package might be useful.

Here is an example.

Extract raw rules from a random forest:

library(inTrees)
library(randomForest) 
data(iris)
X <- iris[, 1:(ncol(iris) - 1)]  # X: predictors
target <- iris[,"Species"]  # target: class
rf <- randomForest(X, as.factor(target))
treeList <- RF2List(rf)  # transform rf object to an inTrees' format
exec <- extractRules(treeList, X)  # R-executable conditions
exec[1:2,]
#       condition                 
# [1,] "X[,1]<=5.45 & X[,4]<=0.8"
# [2,] "X[,1]<=5.45 & X[,4]>0.8"

Measure rules. len is the number of variable-value pairs in a condition, freq is the percentage of data satisfying a condition, pred is the outcome of a rule, i.e., condition => pred, err is the error rate of a rule.

ruleMetric <- getRuleMetric(exec,X,target)  # get rule metrics
ruleMetric[1:2,]
#      len  freq    err     condition                  pred        
# [1,] "2" "0.3"   "0"     "X[,1]<=5.45 & X[,4]<=0.8" "setosa"    
# [2,] "2" "0.047" "0.143" "X[,1]<=5.45 & X[,4]>0.8"  "versicolor"

Prune each rule:

ruleMetric <- pruneRule(ruleMetric, X, target)
ruleMetric[1:2,]
#      len  freq    err     condition                 pred        
# [1,] "1" "0.333" "0"     "X[,4]<=0.8"              "setosa"    
# [2,] "2" "0.047" "0.143" "X[,1]<=5.45 & X[,4]>0.8" "versicolor"

Select a compact rule set:

(ruleMetric <- selectRuleRRF(ruleMetric, X, target))
#          len freq    err     condition                                             pred         impRRF              
# [1,] "1" "0.333" "0"     "X[,4]<=0.8"                                          "setosa"     "1"                 
# [2,] "3" "0.313" "0"     "X[,3]<=4.95 & X[,3]>2.6 & X[,4]<=1.65"               "versicolor" "0.806787615686919" 
# [3,] "4" "0.333" "0.04"  "X[,1]>4.95 & X[,3]<=5.35 & X[,4]>0.8 & X[,4]<=1.75"  "versicolor" "0.0746284932951366"
# [4,] "2" "0.287" "0.023" "X[,1]<=5.9 & X[,2]>3.05"                             "setosa"     "0.0355855756152103"
# [5,] "1" "0.307" "0.022" "X[,4]>1.75"                                          "virginica"  "0.0329176860493297"
# [6,] "4" "0.027" "0"     "X[,1]>5.45 & X[,3]<=5.45 & X[,4]<=1.75 & X[,4]>1.55" "versicolor" "0.0234818254947883"
# [7,] "3" "0.007" "0"     "X[,1]<=6.05 & X[,3]>5.05 & X[,4]<=1.7"               "versicolor" "0.0132907201116241"

Build an ordered rule list as a classifier:

(learner <- buildLearner(ruleMetric, X, target))
#      len freq                 err                  condition                                             pred        
# [1,] "1" "0.333333333333333"  "0"                  "X[,4]<=0.8"                                          "setosa"    
# [2,] "3" "0.313333333333333"  "0"                  "X[,3]<=4.95 & X[,3]>2.6 & X[,4]<=1.65"               "versicolor"
# [3,] "4" "0.0133333333333333" "0"                  "X[,1]>5.45 & X[,3]<=5.45 & X[,4]<=1.75 & X[,4]>1.55" "versicolor"
# [4,] "1" "0.34"               "0.0196078431372549" "X[,1]==X[,1]"                                        "virginica" 

Make rules more readable:

readableRules <- presentRules(ruleMetric, colnames(X))
readableRules[1:2, ]
#      len  freq    err     condition                                                                       pred        
# [1,] "1" "0.333" "0"     "Petal.Width<=0.8"                                                              "setosa"    
# [2,] "3" "0.313" "0"     "Petal.Length<=4.95 & Petal.Length>2.6 & Petal.Width<=1.65"                     "versicolor"

Extract frequent variable interactions (note the rules are not pruned or selected):

rf <- randomForest(X, as.factor(target))
treeList <- RF2List(rf)  # transform rf object to an inTrees' format
exec <- extractRules(treeList, X)  # R-executable conditions
ruleMetric <- getRuleMetric(exec, X, target)  # get rule metrics
freqPattern <- getFreqPattern(ruleMetric)
# interactions of at least two predictor variables
freqPattern[which(as.numeric(freqPattern[, "len"]) >= 2), ][1:4, ]
#      len sup     conf    condition                  pred        
# [1,] "2" "0.045" "0.587" "X[,3]>2.45 & X[,4]<=1.75" "versicolor"
# [2,] "2" "0.041" "0.63"  "X[,3]>4.75 & X[,4]>0.8"   "virginica" 
# [3,] "2" "0.039" "0.604" "X[,4]<=1.75 & X[,4]>0.8"  "versicolor"
# [4,] "2" "0.033" "0.675" "X[,4]<=1.65 & X[,4]>0.8"  "versicolor"

One can also present these frequent patterns in a readable form using function presentRules.

In addition, rules or frequent patterns can be formatted in LaTex.

library(xtable)
print(xtable(freqPatternSelect), include.rownames=FALSE)
# \begin{table}[ht]
# \centering
# \begin{tabular}{lllll}
#   \hline
#   len & sup & conf & condition & pred \\ 
#   \hline
#   2 & 0.045 & 0.587 & X[,3]$>$2.45 \& X[,4]$<$=1.75 & versicolor \\ 
#   2 & 0.041 & 0.63 & X[,3]$>$4.75 \& X[,4]$>$0.8 & virginica \\ 
#   2 & 0.039 & 0.604 & X[,4]$<$=1.75 \& X[,4]$>$0.8 & versicolor \\ 
#   2 & 0.033 & 0.675 & X[,4]$<$=1.65 \& X[,4]$>$0.8 & versicolor \\ 
#   \hline
# \end{tabular}
# \end{table}
Max Ghenis
  • 14,783
  • 16
  • 84
  • 132
H.D.
  • 411
  • 4
  • 4
38

Looking at the rules applied by each individual tree

Assuming that you use the randomForest package this is how you access the fitted trees in the forest.

library(randomForest)
data(iris)
rf <- randomForest(Species ~ ., iris)
getTree(rf, 1)

This show the output of tree #1 of 500:

   left daughter right daughter split var split point status prediction
1              2              3         3        2.50      1          0
2              0              0         0        0.00     -1          1
3              4              5         4        1.65      1          0
4              6              7         4        1.35      1          0
5              8              9         3        4.85      1          0
6              0              0         0        0.00     -1          2
...

You start reading at the first line which describes the root split. The root split was based on variable 3, i.e. if Petal.Length <= 2.50 continue to the left daughter node (line 2) and if Petal.Length > 2.50 continue to the right daughter node (line 3). If the status of a line is -1, as it is on line 2, it means we have reached a leaf and will make a prediction, in this case class 1, i.e. setosa.

It is all written in the manual actually so have a look at ?randomForest and ?getTree for more details.

Looking at variable importance across the whole forest

Have a look at ?importance and ?varImpPlot. This gives you a single score per variable aggregated across the whole forest.

> importance(rf)
             MeanDecreaseGini
Sepal.Length         10.03537
Sepal.Width           2.31812
Petal.Length         43.82057
Petal.Width          43.10046
Backlin
  • 14,612
  • 2
  • 49
  • 81
  • I understand the output of getTree, but how can I visualize it in Tree structure is the doubt actually. As I have categorical variables, the split point is to be converted in binary and then manually form a tree (which is bit tedius) – user2061730 Feb 21 '13 at 09:43
  • 3
    By googling `"plot randomforest tree"` I found this quite extensive answer: [How to actually plot a sample tree from randomForest::getTree()?](http://stats.stackexchange.com/questions/41443/how-to-actually-plot-a-sample-tree-from-randomforestgettree) Unfortunately, it seems there is no readily available function for it unless you switch to the `cforest` implementation of random forest (in the `party` package). Moreover, if you wanted to know how to plot a tree you should have written it in you original question. At the moment it is not very specific. – Backlin Feb 21 '13 at 10:15
  • I want to not actually plot a tree but find what is the combination of variables considered for best data points (Good respondents) – user2061730 Feb 21 '13 at 11:30
  • 1
    I am sorry but I don't know what you are after here. What are the "best data points"? Judging from your other questions too I think you should read the [faq on what to ask on stackoverflow and how to ask](http://stackoverflow.com/faq), and you even get a badge for it :) Basically your questions should be clear, not too broad and preferably include an example (a mock up of the result you would like to get or a piece of code that does not work). – Backlin Feb 21 '13 at 12:11
  • How can we say that line1 `Petal.Length <= 2.50` it could be `Petal.Length > 2.50`. How we come up with `>` or `<` for a condition? – Kartheek Palepu Apr 29 '16 at 05:55
  • It's explained in `?getTree`: "For numerical predictors, data with values of the variable less than or equal to the splitting point go to the left daughter node." – Backlin May 03 '16 at 10:54
  • I just wanted to recommend setting ```labelVar=TRUE``` in ```getTree``` to get the names of your variables in the output rather than keeping track by index. – rsmith54 Mar 12 '19 at 21:43
7

In addition to the great answers above, I found interesting another instrument designed to explore the general outputs of a random forest: function explain_forest the package randomForestExplainer. See here for further details.

example code:

library(randomForest)
data(Boston, package = "MASS")
Boston$chas <- as.logical(Boston$chas)
set.seed(123)
rf <- randomForest(medv ~ ., data = Boston, localImp = TRUE)

Please, note: localImp has to be set as TRUE, otherwise the explain_forest will quit with an error

library(randomForestExplainer)
setwd(my/destination/path)
explain_forest(rf, interactions = TRUE, data = Boston)

This will generate an .html file, named Your_forest_explained.html, in your my/destination/path that you can easily open in a Web Browser.

In this report you'll find useful information about the structure of trees and forest and several useful statistics about the variables.

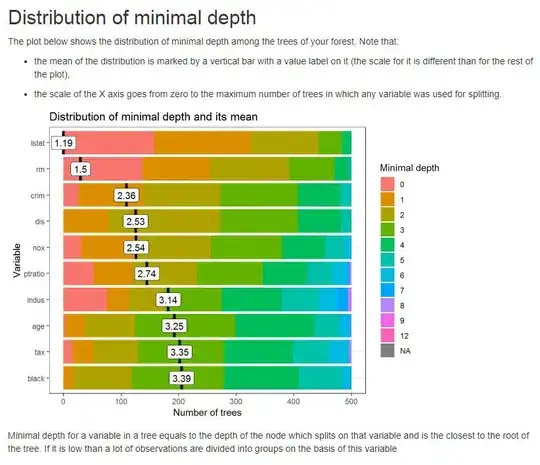
As an example, see below a plot of the distribution of minimal depth among the trees of the grown forest

enter image description here

or one of the multi-way importance plots

enter image description here

You can refer to this for the interpretation of the report.

Nemesi
  • 781
  • 3
  • 13
  • 29
1

Along with the above answers, I would like to add a few more pointers. Explainability is a hot research area. Recently, newer tools have been developed to explain tree ensemble models using a handful of human understandable rules. Here are a few options for explaining tree ensemble models, that you can try:

You can use TE2Rules (Tree Ensembles to Rules) to extract human understandable rules to explain a scikit tree ensemble (like GradientBoostingClassifier). It provides levers to control interpretability, fidelity and run time budget to extract useful explanations. Rules extracted by TE2Rules are guaranteed to closely approximate the tree ensemble, by considering the joint interactions of multiple trees in the ensemble.

Another, alternative is SkopeRules, which is a part of scikit-contrib. SkopeRules extract rules from individual trees in the ensemble and filters good rules with high precision/recall across the whole ensemble. This is often quick, but may not represent the ensemble well enough.

For developers who work in R, InTrees package is a good option.

References:

TE2Rules: You can find the code: https://github.com/linkedin/TE2Rules and documentation: https://te2rules.readthedocs.io/en/latest/ here.

SkopeRules: You can find the code: https://github.com/scikit-learn-contrib/skope-rules here.

Intrees: https://cran.r-project.org/web/packages/inTrees/index.html

Disclosure: I'm one of the core developers of TE2Rules.