Is it possible to clip an image generated by imshow() to the area under a line/multiple lines? I think Clip an image using several patches in matplotlib may have the solution, but I'm not sure how to apply it here.
I just want the coloring (from imshow()) under the lines in this plot:
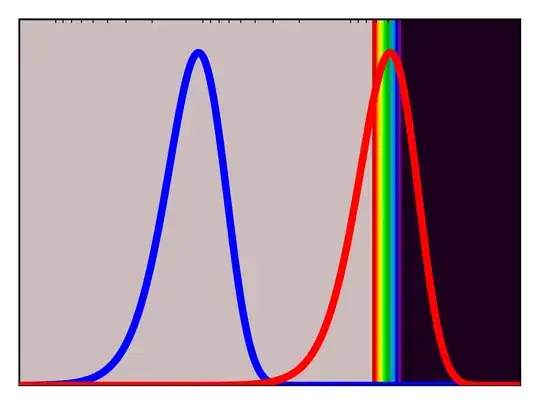
Here is my plotting code:
from __future__ import division
from matplotlib.pyplot import *
from numpy import *

# wavelength array
lambd = logspace(-3.8, -7.2, 1000)

# temperatures
T_earth = 300
T_sun = 6000

# planck's law constants
h = 6.626069e-34
c = 2.997925e8
k = 1.380648e-23

# compute power using planck's law
power_earth = 2*h*c**2/lambd**5 * 1/(exp(h*c/(lambd*k*T_earth)) - 1)
power_sun = 2*h*c**2/lambd**5 * 1/(exp(h*c/(lambd*k*T_sun)) - 1)

# set up color array based on "spectrum" colormap
colors = zeros((1000,1000))
colors[:,:1000-764] = 0.03
for x,i in enumerate(range(701,765)):
    colors[:,1000-i] = 1-x/(765-701)
colors[:,1000-701:] = 0.98

figure(1,(4,3),dpi=100)
# plot normalized planck's law graphs
semilogx(lambd, power_earth/max(power_earth), 'b-', lw=4, zorder=5); hold(True)
semilogx(lambd, power_sun/max(power_sun), 'r-', lw=4, zorder=5); hold(True)
# remove ticks (for now)
yticks([]); xticks([])
# set axis to contain lines nicely
axis([min(lambd), max(lambd), 0, 1.1])
# plot colors, shift extent to match graph
imshow(colors, cmap="spectral", extent=[min(lambd), max(lambd), 0, 1.1])
# reverse x-axis (longer wavelengths to the left)
ax = gca(); ax.set_xlim(ax.get_xlim()[::-1])

tight_layout()
show()