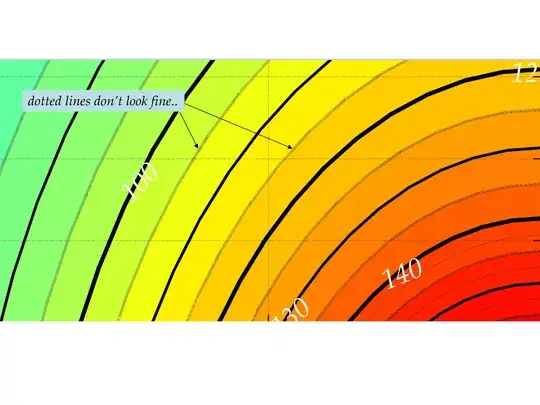
The dotted/dashed lines in Matlab graphs look somewhat fine in the figure window, but when printed, they lose resolution and look really bad. See Figure below. How can I make the dotted/dashed lines look exactly like on screen?
The dotted/dashed lines in Matlab graphs look somewhat fine in the figure window, but when printed, they lose resolution and look really bad. See Figure below. How can I make the dotted/dashed lines look exactly like on screen?
I was having this problem and found a solution on another forum. There are a couple of options. If you don't mind exporting to bitmap you can use an alternative renderer (OpenGL or zbuffer), but for me this was not an acceptable solution. Instead, you can extract the contour information and plot a dashed line instead. I owe the original poster for this solution, but can't remember where I got it.
[c1,h1] = contour(data, Contours,'--k')

% Take all the info from the contourline output argument:
i0 = 1;
i2 = 1;
while i0 <  length(c1)
    i1 = i0+[1:c1(2,i0)];
    zLevel(i2) = c1(1,i0);
    hold on
    % And plot it with dashed lines:
    ph(i2) = plot(c1(1,i1),c1(2,i1),'k--','linewidth',.5);
    i0 = i1(end)+1;
    i2 = i2+1;
end
% Scrap the contourlines:
delete(h1)
Hope that helps! -D
Try to use export_fig from the FEX, it should fix that issue.
I would use the method suggested by Loren from her excellent post on making pretty graphs. It uses a function that she wrote which goes into the output eps file, and tweaks the definition of the dotted lines. fixPSlinestyle is found on the FEX.
figure('renderer','painters')
hold on
plot([1 2 4],[2 3 7],'r-','linewidth',13)
plot([1 2 4],[2.5 3.5 7.5],'b:','linewidth',13)

print(gcf,'-depsc2','withoutedit.eps')
fixPSlinestyle('withoutedit.eps','withedit.eps')
The first figure (withoutedit.eps) is shown on left, and after the eps linestyle has been tweaked is shown at right (withedit.eps):
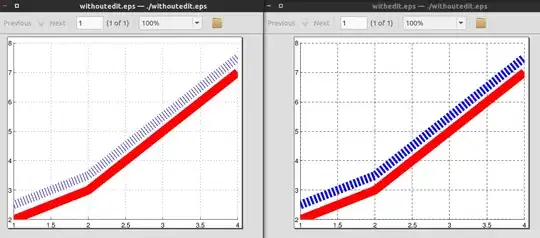
I like this solution because you're not handing complete control to a function - you control the exporting of the figure (through the print command), but you use a function to tweak the final eps file.