55

I am making a stacked bar plot using:

DataFrame.plot(kind='bar',stacked=True)

I want to control width of bars so that the bars are connected to each other like a histogram.

I've looked through the documentation but to no avail - any suggestions? Is it possible to do it this way?

Trenton McKinney
  • 56,955
  • 33
  • 144
  • 158
Osmond Bishop
  • 7,560
  • 14
  • 42
  • 51
  • You *want* to pass in width=1 (to bar) but plot won't let you... :s – Andy Hayden Feb 12 '13 at 09:00
  • Strange. The align keyword behaves as the opposite of mpl and the log keyword is also weird. @Osmond, i would workaround it by using: ax.bar(df.index.values, df.values) – Rutger Kassies Feb 12 '13 at 15:04

4 Answers4

104

For anyone coming across this question:

Since pandas 0.14, plotting with bars has a 'width' command: https://github.com/pydata/pandas/pull/6644

The example above can now be solved simply by using

df.plot(kind='bar', stacked=True, width=1)

See pandas.DataFrame.plot.bar or pandas.DataFrame.plot with kind='bar'.

When changing the width of the bars, it might also be appropriate to change the figure size by specifying the figsize= parameter.

Trenton McKinney
  • 56,955
  • 33
  • 144
  • 158
Murkbeard
  • 1,156
  • 2
  • 8
  • 3
17

If think you have to "postprocess" the barplot with matplotlib as pandas internally sets the width of the bars.

The rectangles which form the bars are in container objects. So you have to iterate through these containers and set the width of the rectangles individually:

In [208]: df = pd.DataFrame(np.random.random((6, 5)) * 10,               
                        index=list('abcdef'), columns=list('ABCDE'))

In [209]: df
Out[209]: 
     A    B    C    D    E
a  4.2  6.7  1.0  7.1  1.4
b  1.3  9.5  5.1  7.3  5.6
c  8.9  5.0  5.0  6.7  3.8
d  5.5  0.5  2.4  8.4  6.4
e  0.3  1.4  4.8  1.7  9.3
f  3.3  0.2  6.9  8.0  6.1

In [210]: ax = df.plot(kind='bar', stacked=True, align='center')

In [211]: for container in ax.containers:
              plt.setp(container, width=1)
   .....:         

In [212]: x0, x1 = ax.get_xlim()

In [213]: ax.set_xlim(x0 -0.5, x1 + 0.25)
Out[213]: (-0.5, 6.5)

In [214]: plt.tight_layout()

stacked_bar.png

bmu
  • 35,119
  • 13
  • 91
  • 108
  • 3
    nice answer. I didn't realize 'postprocessing' was an option – zach May 30 '13 at 13:43
  • I am using df.plot to overplot additional bars on a preexisting bar plot. @bmu, your method does not work for me because it changes all the old plot objects, in addition to the new ones. How to change the width of just the bars newly created by df.plot()? – CPBL Feb 18 '14 at 10:23
  • @ChristopherBarrington-Leigh Maybe you could start the iteration over the container objects at a later index (at the number of your previous container objects), however an example would be better. I think you should better ask this in a separate question. – bmu Feb 19 '14 at 06:11
2

a matplotlib solution

modify the width parameter in ax.bar as you like enter image description here

code

import numpy as np
import pandas as pd
from matplotlib import pyplot as plt

df = pd.DataFrame(np.arange(15).reshape(5, 3), columns=list('ABC'))

print(df)

fig, axs = plt.subplots(1, 2)

ax = axs[0]
xs = np.arange(df.shape[1])
ys = np.zeros(xs.shape)
for ind in df.index:
    ax.bar(xs, df.loc[ind, :], label=ind, bottom=ys, width=.4)
    ys += df.loc[ind, :]
plt.setp(ax, xticks=xs, xticklabels=list(df))
ax.legend(title='rows')
ax.set_xlabel('columns')

ax = axs[1]
xs = np.arange(df.shape[0])
ys = np.zeros(xs.shape)
for col in list(df):
    ax.bar(xs, df.loc[:, col], label=col, bottom=ys, width=.4)
    ys += df.loc[:, col]
plt.setp(ax, xticks=xs, xticklabels=df.index.to_numpy().tolist())
ax.legend(title='columns')
ax.set_xlabel('rows')

plt.show()

df=

    A   B   C
0   0   1   2
1   3   4   5
2   6   7   8
3   9  10  11
4  12  13  14
Markus Dutschke
  • 9,341
  • 4
  • 63
  • 58
0

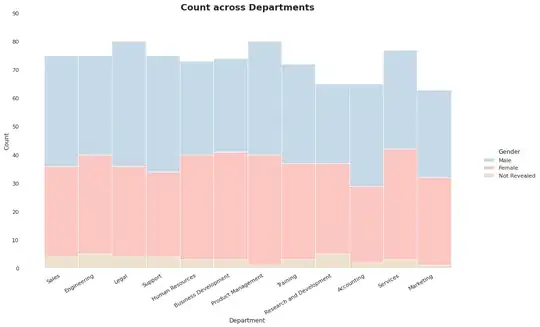
"I want to control the width of bars so that the bars are connected to each other like a histogram."

A better option for the same is to use sns.displot()

Sample code:

emp = pd.read_csv("https://raw.githubusercontent.com/arora123/Data/master/emp-data.csv")

sns.displot(emp, x='Department', hue='Gender', multiple='stack',  
             height=8, aspect=1.7);

enter image description here

Dr Nisha Arora
  • 632
  • 1
  • 10
  • 23
  • Note that: the code will produce the same plot but not the same aesthetics. I've done some customization to reduce the chart junk. – Dr Nisha Arora Mar 24 '21 at 03:45