I'm after some ideas for demonstrating the usefulness of Floyd-Warshall visually. So far all I can think of is generating a random graph, allowing the user to select a start/finish and highlight the shortest path. What are some more fun yet simple demonstrations of the usefulness of path-finding?
3 Answers
Since you will want to show all pairs shortest path (Floyd Warshal) rather than single pair shortes path (Dijkstra) a minimum distances table between all pairs of large cities in a country might be nice. This is not a graphical visualisation, but still a useful one. There used to be such a table in a book with roadmaps that I used, before the days of electronic route planning.
- 6,750
- 2
- 28
- 45
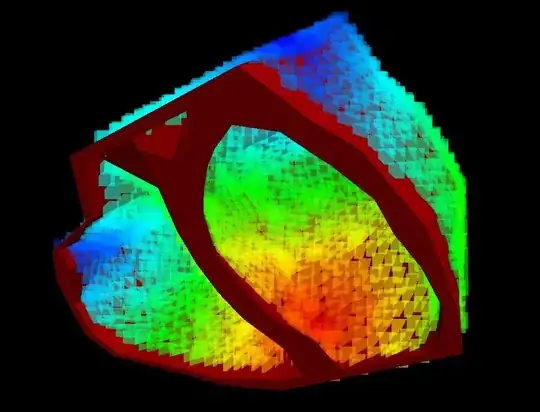
I've used Floyd-Warshall to compute the signal path of cardiac activation as described in this paper in the paragraph 'shortest path of activation'. It proved very practical, fast and simple. Fig. 5 gives you a nice visualisation of the resulting time dependent potentials. In addition to this, the image below visualizes the minimum path lengths computed starting at the sinus node. Blue == short, red == long.
- 6,750
- 2
- 28
- 45
