2

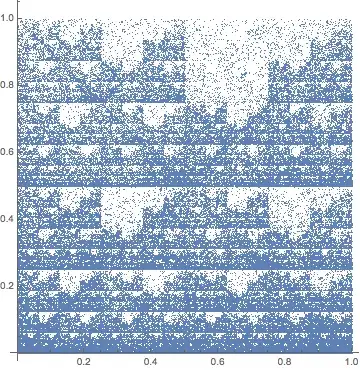
What is this graph called that was generated by D3.js?

enter image description here

Is there a name for it?

I failed to describe it when looking for keywords in the documentation and spent quite a bit of time scouring the web.

Once identifying it, what is one example in the D3 documentation that includes a graph similar to this? I can't appear to find any that would resemble this.

VividD
  • 10,456
  • 6
  • 64
  • 111
user1431282
  • 6,535
  • 13
  • 51
  • 68

2 Answers2

2

That is most likely built via the bundle layout.

Nevir
  • 7,951
  • 4
  • 41
  • 50
2

This diagram is called arc diagram.


An interesting background on arc diagrams can be found at this Manuel Lima's blog post. It includes some historical facts and these intriguing illustrations:

enter image description here

enter image description here

enter image description here


There are several examples of arc diagrams made with D3:

Example 1

Characters from "Les Miserables", by Sophie Engle.

enter image description here

Example 2

Chapters of "The DaVinci Code", by Lynn Cherny.

enter image description here

Example 3

Result of Stanford natural language parser applied to a sentence, by Michael Wayne Goodman.

enter image description here

Example 4

Arc diagrams of RNA secondary structures by Daniel Lai, Jeff R. Proctor, Jing Yun A. Zhu, and Irmtraud M. Meyer.

enter image description here

VividD
  • 10,456
  • 6
  • 64
  • 111