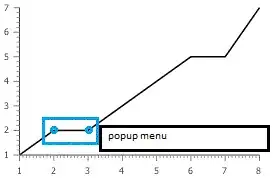
I want to select two or more markers in a chart and perform an action using their coordinates. Selecting the points is the main problem since I didn't find anything on this topic and I'm not sure if it can be done.
I want to select two or more markers in a chart and perform an action using their coordinates. Selecting the points is the main problem since I didn't find anything on this topic and I'm not sure if it can be done.
I did something like this in a Pie Chart.
What I did was use "connectToPlot" to change the series color when the user click on it.
This is a resume of the work that I did: change series color when user click on it
See that when you click on the serie, the color changes to gray and if you click again the series returns to it original color (saved it in the attribute "originalColor").
pieChart.connectToPlot("default", function(evt) {

                var shape = evt.shape;
                var type  = evt.type;

                if (type == "onclick") {
                     var fillColor = "rgb("+shape.fillStyle.r+", "+shape.fillStyle.g+", "+shape.fillStyle.b+")"; console.log(shape.fillStyle);
                    if(shape.rawNode.getAttribute("originalColor")==null)
                        shape.rawNode.setAttribute("originalColor",fillColor);

    var strokeColor = "rgb("+shape.strokeStyle.color.r+", "+shape.strokeStyle.color.g+", "+shape.strokeStyle.color.b+")";

                   if(fillColor=='rgb(238, 238, 238)'){
                        shape.setFill(shape.rawNode.getAttribute("originalColor"));
                        shape.setStroke(shape.rawNode.getAttribute("originalColor"));
                   }else{
                        shape.setFill('rgb(238, 238, 238)');
                        shape.setStroke(shape.rawNode.getAttribute("originalColor"));
                   }
                }