I have an image, holding results of segmentation, like this one.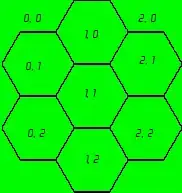
I need to build a graph of neighborhood of patches, colored in different colors.
As a result I'd like a structure, representing the following

Here numbers represent separate patches, and lines represent patches' neighborhood. Currently I cannot figure out where to start, which keywords to google.
Could anyone suggest anything useful?
Image is stored in OpenCV's cv::Mat class, as for graph, I plan to use Boost.Graph library.
So, please, give me some links to code samples and algorithms, or keywords.
Thanks.
Update. After a coffee-break and some discussions, the following has come to my mind.
- Build a large lattice graph, where each node corresponds to each image pixel, and links connect 8 or 4 neighbors.
- Label each graph node with a corresponding pixel value.
- Try to merge somehow nodes with the same label.
My another problem is that I'm not familiar with the BGL (but the book is on the way :)).
So, what do you think about this solution?
Update2 Probably, this link can help.
However, the solution is still not found.