I am pretty new to Matlab and I am trying to write a simple frequency based speech detection algorithm. The end goal is to run the script on a wav file, and have it output start/end times for each speech segment. If use the code:
fr = 128;
[ audio, fs, nbits ] = wavread(audioPath);
spectrogram(audio,fr,120,fr,fs,'yaxis')
I get a useful frequency intensity vs. time graph like this:
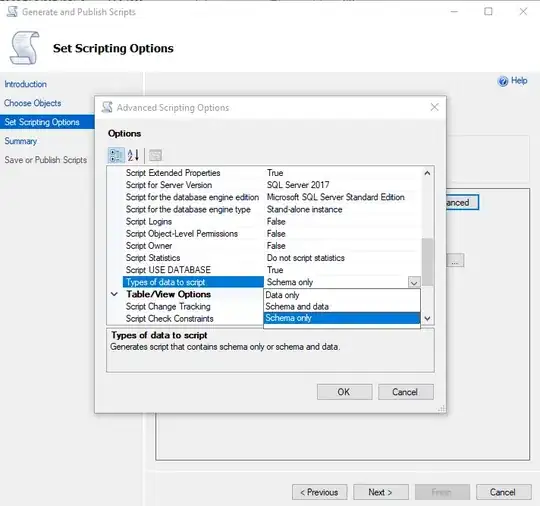
By looking at it, it is very easy to see when speech occurs. I could write an algorithm to automate the detection process by looking at each x-axis frame, figuring out which frequencies are dominant (have the highest intensity), testing the dominant frequencies to see if enough of them are above a certain intensity threshold (the difference between yellow and red on the graph), and then labeling that frame as either speech or non-speech. Once the frames are labeled, it would be simple to get start/end times for each speech segment.
My problem is that I don't know how to access that data. I can use the code:
[S,F,T,P] = spectrogram(audio,fr,120,fr,fs);
to get all the features of the spectrogram, but the results of that code don't make any sense to me. The bounds of the S,F,T,P arrays and matrices don't correlate to anything I see on the graph. I've looked through the help files and the API, but I get confused when they start throwing around algorithm names and acronyms - my DSP background is pretty limited.
How could I get an array of the frequency intensity values for each frame of this spectrogram analysis? I can figure the rest out from there, I just need to know how to get the appropriate data.