I'd like to ask if it is possible to have a time series chart with dual x-axis (or y-axis but because it is a time series dataset I focus on dual x-axis). I have two data files in which the measurements were made during a minute or a whole day. As a result I can't have one x-axis. So, one solution is to transmorm one data file to the format of the other or to have two different x-axis. The second solution is it possible to be done?
I found JFreeChartDualAxisDemo
but it isn't what I want.
Thanks in advance for any help!!!
EDIT:
I have the following code and I'm trying to create a Time Series Chart with two datasets which belong to a specific x-axes (As you can see I created two x-axes). I tried to execute this code but the chart that creates isn't right and in fact it has only the x-axes and y-axis. Can someone tell me where is the fault?
int year1 = 2004;
int year2 = 2005;
int year3 = 2006;
int year4 = 2007;

int month1 = 1;
int month2 = 5;
int month3 = 8;
int month4 = 12;

int day1 = 3;
int day2 = 10;
int day3 = 15;
int day4 = 30;


TimeSeries ts= new TimeSeries("Metrisi", Day.class);
ts.add(new Day(day1, month1, year1), 100);
ts.add(new Day(day2, month2, year2), 150);
ts.add(new Day(day3, month3, year3), 250);
ts.add(new Day(day4, month4, year4), 275);

TimeSeriesCollection dataset = new TimeSeriesCollection();
dataset.addSeries(ts);


int year1_2 = 2004;
int year2_2 = 2005;
int year3_2 = 2006;
int year4_2 = 2007;

int month1_2 = 2;
int month2_2 = 7;
int month3_2 = 9;
int month4_2 = 11;

int day1_2 = 23;
int day2_2 = 14;
int day3_2 = 19;
int day4_2 = 22;


TimeSeries ts2= new TimeSeries("Metrisi", Day.class);
ts.add(new Day(day1_2, month1_2, year1_2), 100);
ts.add(new Day(day2_2, month2_2, year2_2), 150);
ts.add(new Day(day3_2, month3_2, year3_2), 250);
ts.add(new Day(day4_2, month4_2, year4_2), 275);

TimeSeriesCollection dataset2 = new TimeSeriesCollection();
dataset.addSeries(ts2);


JFreeChart chart = ChartFactory.createTimeSeriesChart(
"Measurement",
"Date",
"Measurement",
dataset,
true,
true,
false);

final XYPlot plot = chart.getXYPlot();

plot.setBackgroundPaint(Color.lightGray);
plot.setDomainGridlinePaint(Color.white);
plot.setRangeGridlinePaint(Color.white);
plot.setDomainCrosshairVisible(true);
plot.setRangeCrosshairVisible(false);


final DateAxis axis2 = new DateAxis("Secondary");
//xAxis2.setAutoRangeIncludesZero(false);
//plot.setDomainAxis(1, axis );
plot.setRangeAxis(1, axis2);
plot.setDataset(1, dataset2);
plot.mapDatasetToRangeAxis(1, 1);

 final XYItemRenderer renderer = plot.getRenderer();
 renderer.setToolTipGenerator(StandardXYToolTipGenerator.getTimeSeriesInstance());
if (renderer instanceof StandardXYItemRenderer) {
    final StandardXYItemRenderer rr = (StandardXYItemRenderer) renderer;
    //rr.setPlotShapes(true);

    rr.setShapesFilled(true);
    //renderer.setSeriesStroke(0, new BasicStroke(2.0f));
    //renderer.setSeriesStroke(1, new BasicStroke(2.0f));
   }

final StandardXYItemRenderer renderer2 = new StandardXYItemRenderer();
renderer2.setSeriesPaint(0, Color.black);
//renderer2.setPlotShapes(true);
renderer.setToolTipGenerator(StandardXYToolTipGenerator.getTimeSeriesInstance());
plot.setRenderer(1, renderer2);

final DateAxis axis = (DateAxis) plot.getDomainAxis();
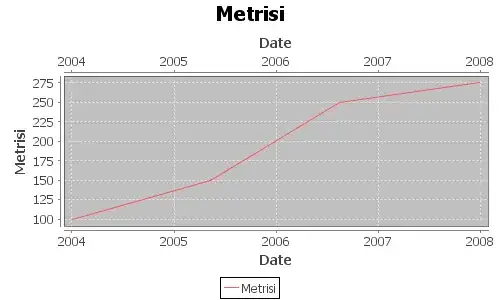
This is what I'am trying to do. As you can see I have two x-axes but only one dataset and that it's the problem. I have done the example that is shown in the image with the following code:
    final XYPlot plot = chart.getXYPlot();

    plot.setBackgroundPaint(Color.lightGray);
    plot.setDomainGridlinePaint(Color.white);
    plot.setRangeGridlinePaint(Color.white);
    plot.setDomainCrosshairVisible(true);
    plot.setRangeCrosshairVisible(false);


    final XYItemRenderer renderer = plot.getRenderer();
    if (renderer instanceof StandardXYItemRenderer) {
        final StandardXYItemRenderer rr = (StandardXYItemRenderer) renderer;
        //rr.setPlotShapes(true);
        rr.setShapesFilled(true);
        renderer.setSeriesStroke(0, new BasicStroke(2.0f));
        renderer.setSeriesStroke(1, new BasicStroke(2.0f));
       }

    final DateAxis axis = (DateAxis) plot.getDomainAxis();

    final DateAxis xAxis2 = (DateAxis) plot.getDomainAxis();
    plot.setDomainAxis(1, xAxis2 );
    plot.mapDatasetToDomainAxis(1, 1);