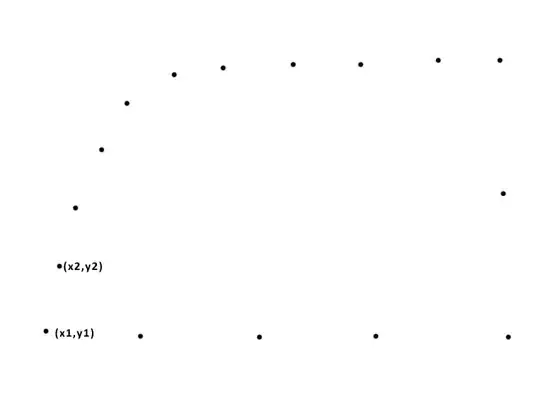
I am using the following data default data: 37.705 54.098 55.738 75.41 52.459 73.77 68.852 55.738
//chart.googleapis.com/chart
   ?chxs=0,676767,11.5,0,l,676767
   &chxt=y
   &chs=300x225
   &cht=lc
   &chco=3D7930
   &chd=s:Xhiugtqi
   &chg=14.3,-1,1,1
   &chls=2,4,0
   &chm=B,C5D4B5BB,0,0,0
My question is, why (and how do you stop) google charts from rescaling your data when you change the range of the y-axis?
For instance here I cap the y-axis range to 40 but it scales all data down... this is bad for me. I need it to show the actual data values no matter what the y-axis cap is.
//chart.googleapis.com/chart
   ?chxr=0,0,40
   &chxs=0,676767,11.5,0,l,676767
   &chxt=y
   &chs=300x225
   &cht=lc
   &chco=3D7930
   &chd=s:Xhiugtqi
   &chg=14.3,-1,1,1
   &chls=2,4,0
   &chm=B,C5D4B5BB,0,0,0
Any thoughts?